
🛰️ The Media Buyer Newsletter
Sign up for free performance benchmarks in your inbox every week. Meta, TikTok, Applovin and more!
Click here to sign up for our free newsletter! northbeam.io/newsletter
Technical Documentation
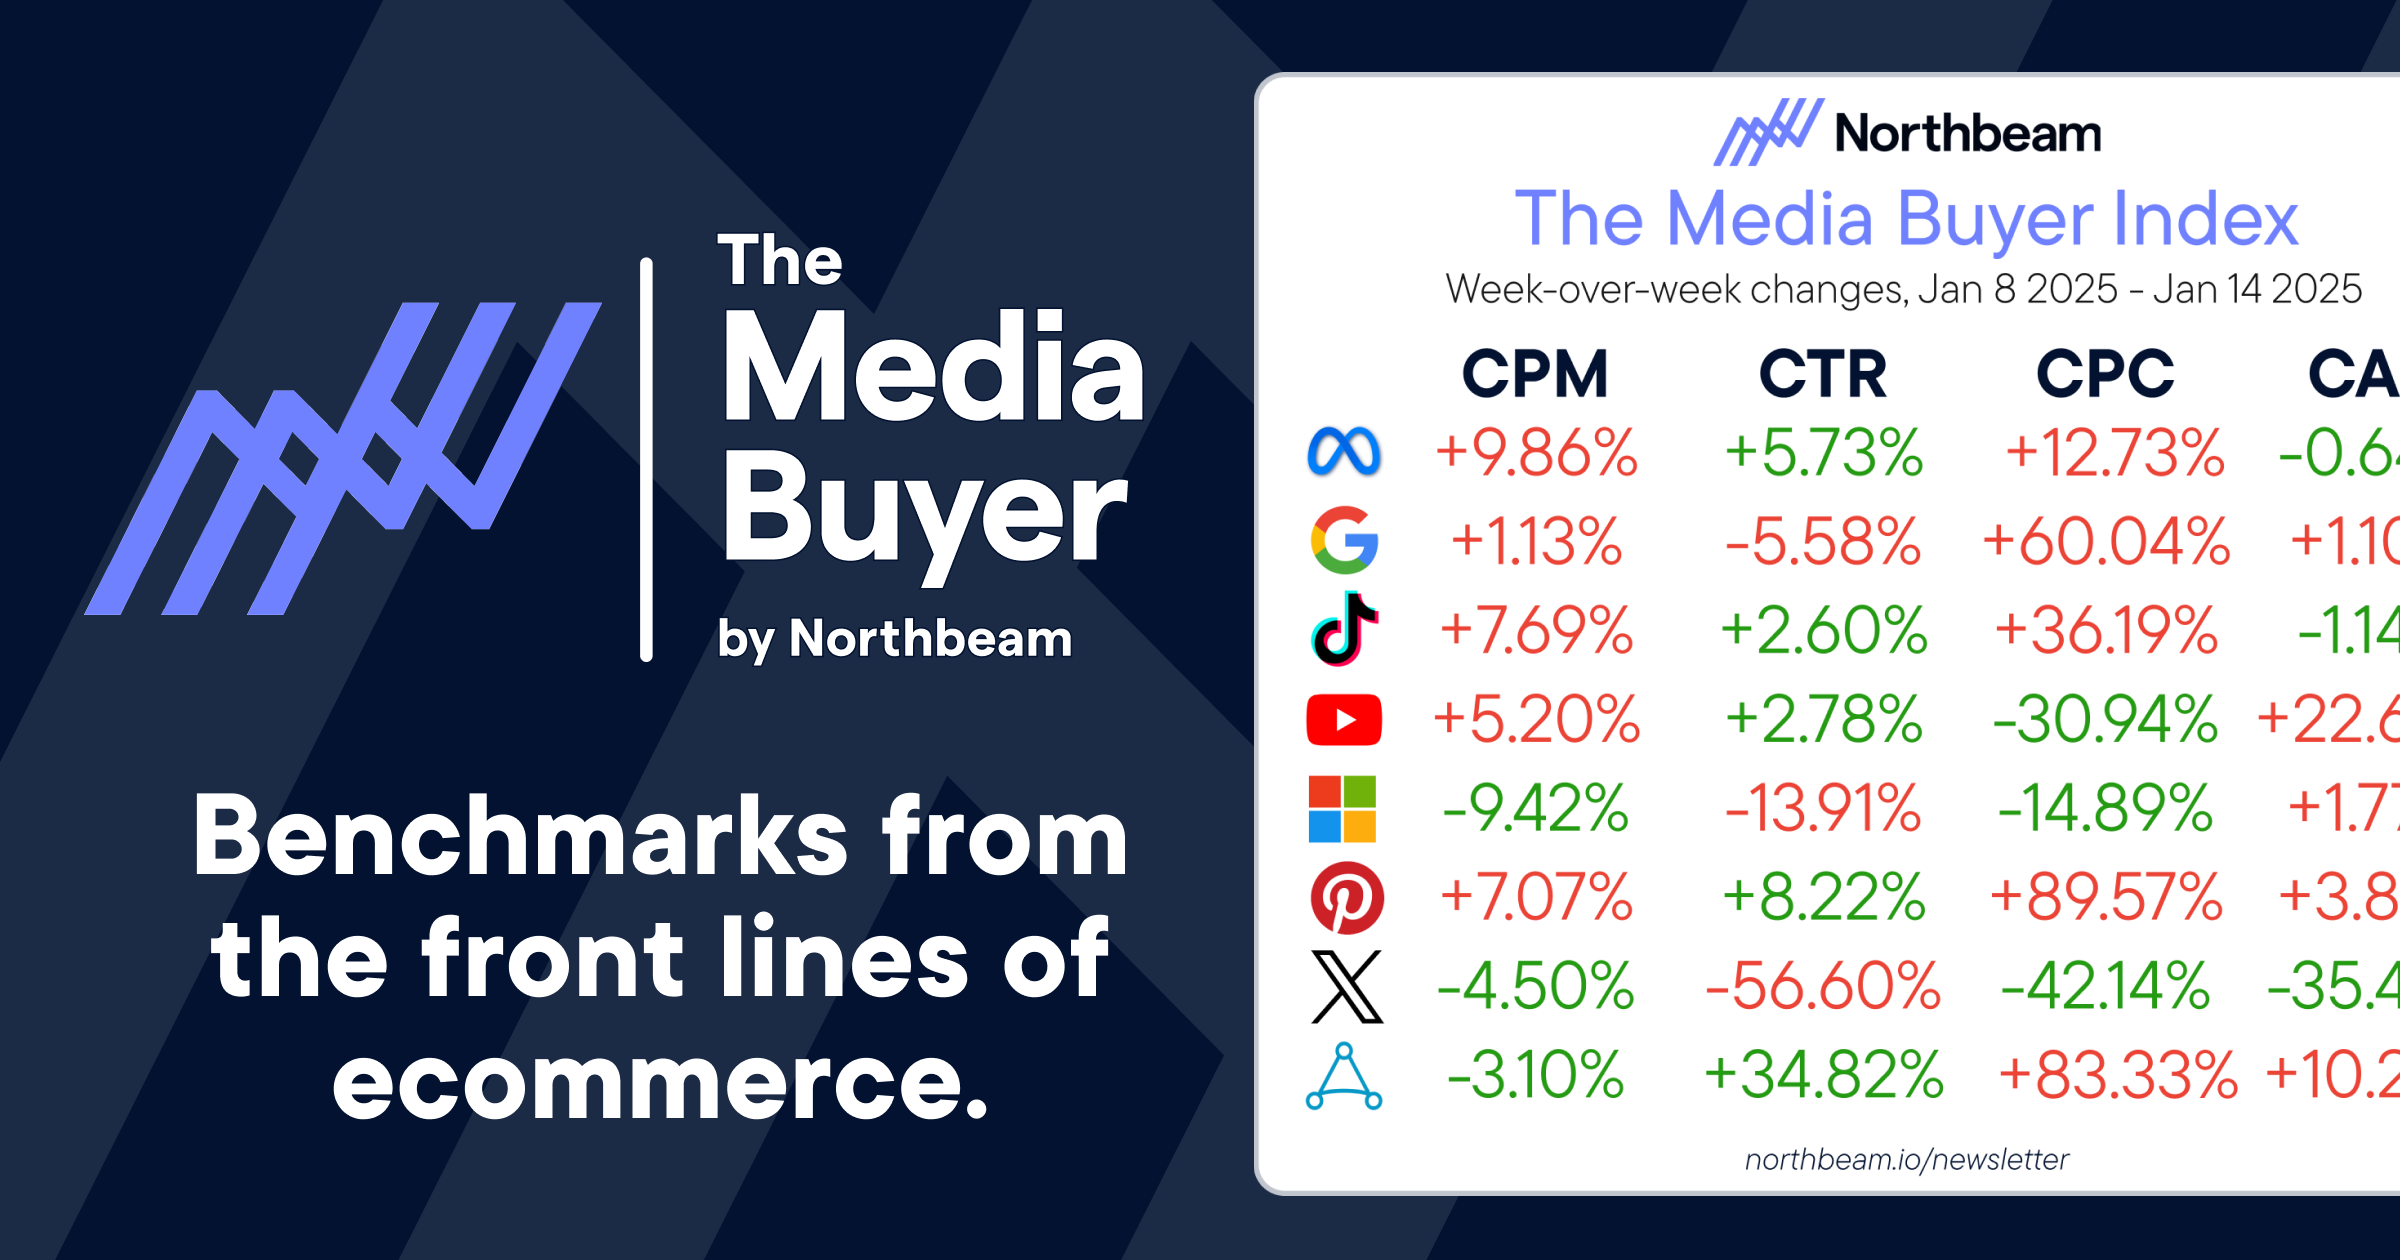
The data presented in The Media Buyer Index is aggregate performance across all brands using Northbeam, with specific brand outliers removed at the top and bottom of each metric range.
Northbeam tracks tens of billions of dollars in ad spend. However, this data is not representative of the entire advertising market - only brands who use Northbeam are tracked in the data. In that respect, this Index is best understood as a measure of week-by-week performance of brands using Northbeam for their marketing.
How this data is calculated
For each metric, for each brand using Northbeam, we calculate average daily performance over a time period, removing outliers caused by irregularities related to ad budgets, glitches in ad platforms, massive or miniscule ad budgets, and more.
A second average is created across all Northbeam-empowered brands, then those averages are compared over time periods, giving the visual you see in the newsletter.
For example: it's not that CPMs have increased by a total of 4%, it's that the average CPM has increased 4% week over week. This could result in tiny, hundredth-of-a-degree decimal point changes in the data appearing as +200% week over week changes.
Because of the variability in individual performance seen across brands, we didn't want to show absolute numbers for performance as that would be misleading.
Instead, you can look at your week-over-week performance changes in your own data and compare them to this index. That allows you to understand if you're getting hit with market-wide seasonality or algorithmic changes, giving you peace of mind that your ad performance is in line with the wider trend.
Please direct all questions to [email protected].
Updated 10 months ago