
💸 Profit Benchmarks
A step-by-step guide to our new benchmarking tool.
What are Profit Benchmarks?
Watch this video for the full tour and explanation!
Profit Benchmarks is a tool within Northbeam that identifies the data-driven performance benchmarks your advertising campaigns must hit in order to achieve profitability.
Through a step-by-step process, Profit Benchmarks takes your profit goals, promotional periods, and omnichannel marketing performance, and then gives you account-wide targets for ROAS, MER, and more.
Those benchmarks are then linked throughout your Northbeam dashboards via “red, yellow, and green stoplight” visual cues, letting you quickly understand how well your ads are performing against your long-term goals.
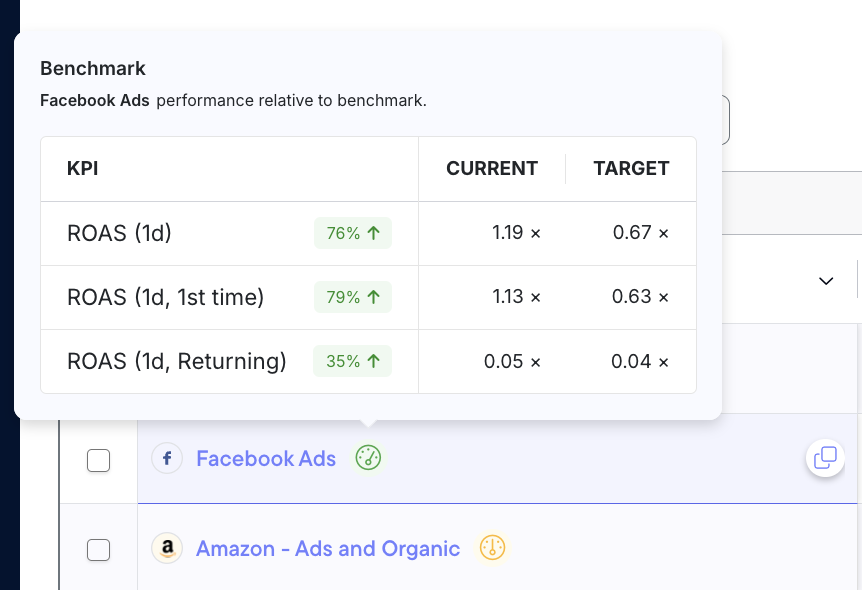
An example tooltip created by Profit Benchmarks, visible in the Sales Attribution dashboard.
With Profit Benchmarks, you don’t have to look at every number in your dashboard to understand your performance, just the numbers that are standing out.
By establishing performance targets for each of your campaigns, you can demystify what constitutes a “good” or “bad” ad campaign in the context of your specific business.Rather than focusing on external performance benchmarks from your industry or competitors, you are setting performance goals based on your own business context.
The entire tool is designed with one goal in mind: setting goals to make your marketing profit.
This is the benchmarking approach you've been hoping for. This is the "secret sauce" used by many of the world's best performance marketers, turned into an easy tool that you can implement in just a few minutes.
This guide will help you understand how to use the tool, calculate your benchmarks, and interpret those benchmarks against your own business goals. We recommend you read this guide while you are setting up your first benchmarks.
Where are Profit Benchmarks?
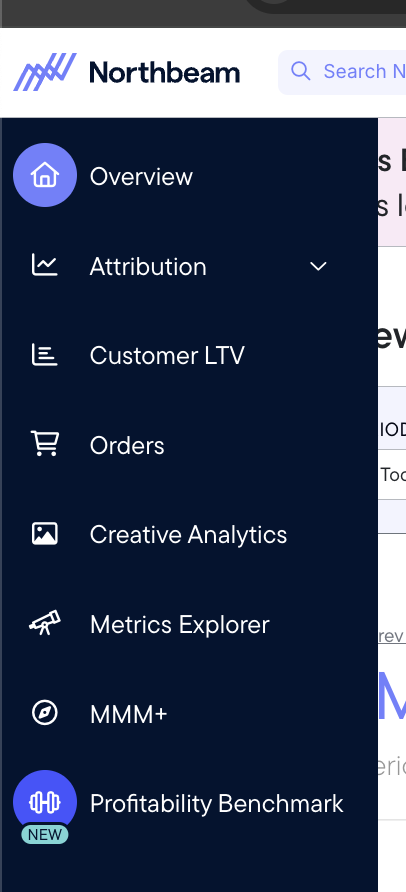
The Profit Benchmarks tool is located on the left-hand side, on the Northbeam navigation bar.
How to use Profit Benchmarks
This product is available after 30 days, BUT we recommend you have at least 90 days of data in Northbeam before trying to establish benchmarks.This ensures statistical significance against your historical performance.
Before you begin setting benchmarks, be sure to collect the following:
- Post-Onboarding, have at least 30 days of Northbeam data but best results after you have 90 days of data.
- Reach out to your Media Strategist or contact Support if you have any questions on the timeline for usage.
- A full understanding of your marketing budget and allocations
- A calculation of cost of goods sold (COGS) at a product or ad level
- An understanding of what a "healthy" business day looks like for your ad account
- Daily-level insight into the historical performance of your ad account and discounting schedule
These insights are helpful for establishing "healthy day" benchmarks across your entire ad account. Once you have this information, you can navigate to the Profit Benchmarks tool and begin the process.
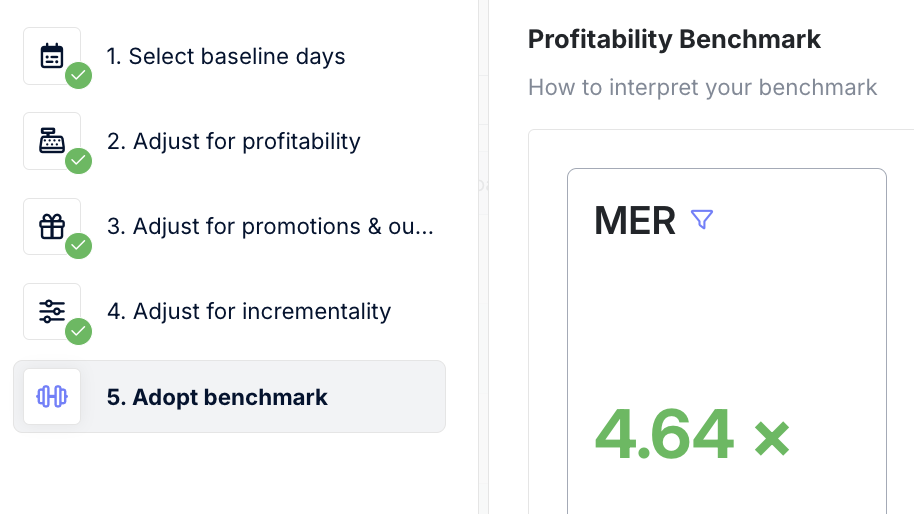
The Five Steps of Creating Benchmarks: A Walkthrough
There are five steps in the Profit Benchmarks tool. You must complete each step, but you are not required to do them in order.
You can move around each step as you’re working on your benchmark, as you may need to adjust data more than once to get the output you expect. You can click the tabs on the left to move between each step, and once you’ve completed a step it will have a green checkmark beside it.
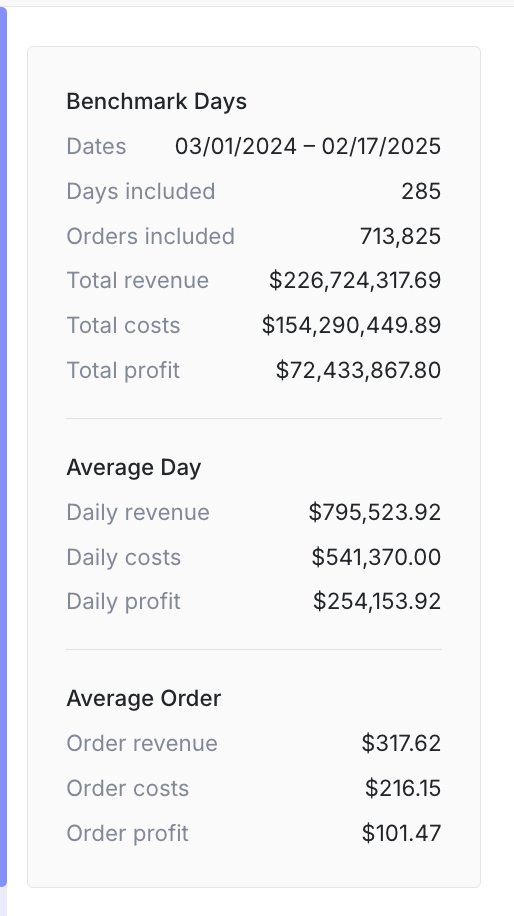
The Benchmark Days Card
In each step of the tool, on the right you will see the "calculations" card. This shows you some quick "temperature checks" so you can understand what your benchmark data looks like. Be sure to check this as you're adjusting each step. The data in this card should feel normal for your ad account. This is critical for getting the benchmarks correct.
Select baseline days
In this step, you will choose a range of historical data that best represents, in your opinion, the data that you want to “beat” with your benchmark targets.
It’s best to choose a range of time that feels most “normal” in your ad account. You will want to choose the longest range of time possible that could reflect what your future marketing strategy could look like.
Adjust for profitability
Here you will define what you consider to be a “profitable day” based on your average cost per order as determined by your costs of goods sold across your business.
This step is critical because it establishes what profitability looks like for your specific business. The easiest way to do this is by percentages.
Adjust for promotions and outliers
On this page you will remove days that don't feel consistent with the rest of your ad performance. It's important in creating benchmarks that your benchmarks are representative of the most "normal" days in your ad account.
In this tab you can choose to remove:
- Promotional outliers: these are days that you maybe were running huge discounts that drove up performance. These would confound your results so it's worth removing if you have them.
- Revenue outliers: sometimes you will have days where perhaps your business went "viral" temporarily, or perhaps you were out of stock on something for a day or two which tanked revenue. This option would remove those days if you have them.
- Order outliers: same as revenue outliers, this is an opportunity to remove days that have more or less orders than the "normal" baseline day.
- Remove spend outliers: sometimes your ad spend is what confounds the data. Perhaps you spiked spend on a day that you went viral, to ride the wave. This option helps you remove that from the data.
- Exclude a date range: here you can freeform remove an entire run of dates. If you had something irregular happen in your ad account and you know the specific range of dates that occurred, we recommend you use this function to remove that range from the benchmark calculation. Remember - you need at least 30 days of good data included to run a good benchmark. The more data you have, the better.
Adjust for Incrementality
In the previous step, you could remove outliers that didn't hit a specific revenue target. In this step, you can remove outliers that you know don't represent profitable days based on some other metric.
In order to create a benchmark of what profitable days look like, we must remove days that are not profitable - by your definition of "profitable."
For example, if you know that any days with Facebook CACs over $100 are not profitable in any circumstance, you can remove those days from your benchmark calculation in this step.
Adopt benchmark
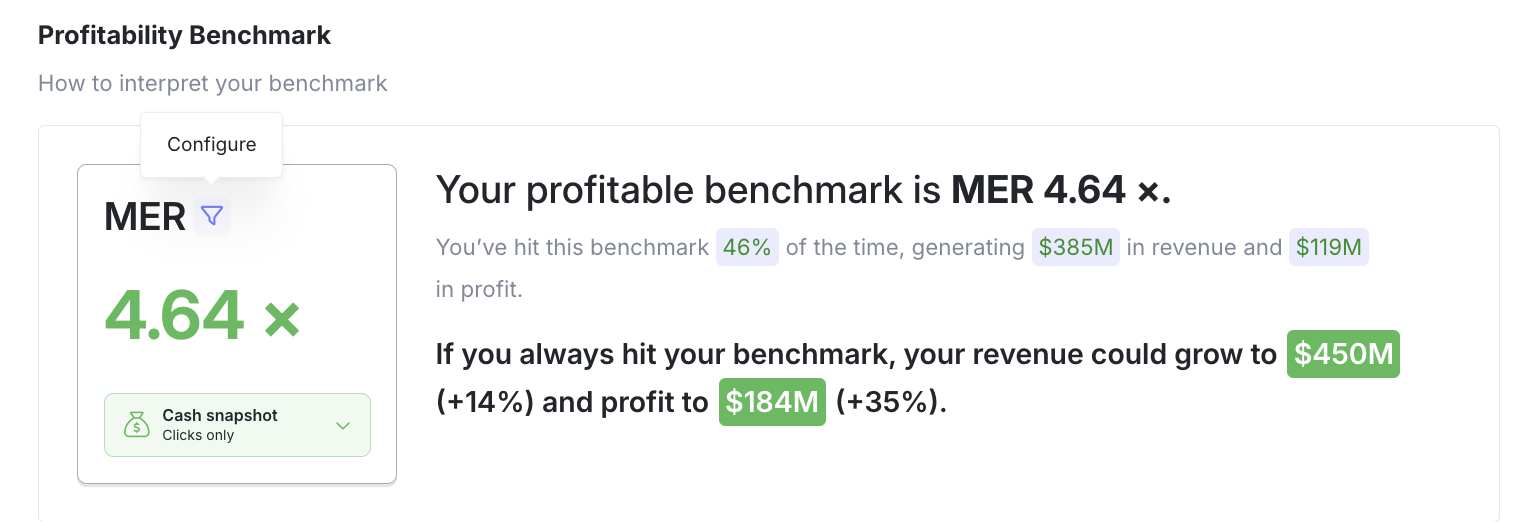
In this step, Profit Benchmarks will calculate the benchmarks that will give your profitable performance. It will also show you what your results could be if the benchmarks are followed.
Important: you can change the target metrics using the "configure" button visible in the screenshot below, above the large number on the left.
Before implementing your benchmark, you'll want to follow these steps:
- Configure your metrics to calculate benchmarks for the metrics that matter the most to you. Do this by clicking the "configure" filter image next to the metrics that are visible.
- Adjust the attribution models for each metric by clicking the dropdown below each large metric number. Pick the model that matters the most to you.
- Review the analysis of the benchmark provided. It will tell you how often you've hit that benchmark and the profit you've created from it. Does this feel accurate? If not you may need to revisit previous steps to recalculate.
- Review the daily profitable KPI results, conversion lag, and channel breakdown charts at the bottom. Do these feel familiar? If not, you may need to adjust your benchmark.
Press the "adopt benchmark" button at the bottom of this screen to apply your benchmark across your entire account. This will adjust the appearance of the stoplight tooltips throughout all your dashboards.
Measuring ads against benchmarks
Now that you've implemented your benchmarks, you will be able to see them using the "stoplight" tooltip hovers throughout your Northbeam dashboards. See an example here:
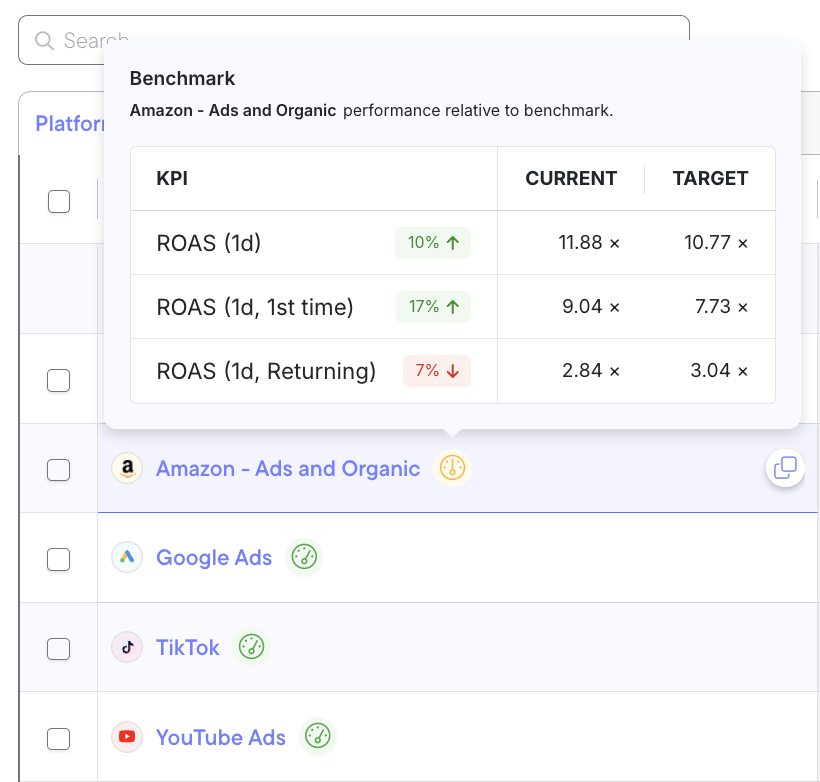
The hovers will always be one of three colors:
- Green: based on all the KPIs you selected during your benchmark process, this ad or set of ads is performing above your targets on all KPIs.
- Yellow: This ad or set of ads has some KPI that is at risk of not meeting the benchmark targets. This ad must be analyzed further to see what's happening.
- Red: this ad or set of ads has a KPI that is clearly below the target threshold for profitability, resulting in this ad or set of ads not being profitable at this moment.
Benchmarks Best Practices
- First time you get a benchmark, go into Metrics Explorer and plot historical performance against your new benchmarks. What metrics or relationships are most impactful on the KPIs that bring good results? This can help you understand which "levers" are most impactful on whether or not you hit your benchmark goals.
- In the sales attribution page, review your channels at the highest level first. Are any of them red or yellow? Dive deeper to identify the problematic ads that are affecting results. Are these ads actually underperforming or is this an issue in how you calculated benchmarks?
- Update your benchmark at least every six months, but ideally every month. The marketing environment of 2025 and beyond is constantly changing. You should update your benchmarks accordingly. This ensures that you're holding your ads against the most recent, most relevant standard.
FAQs
Who can access Profit Benchmarks?
- All Northbeam service levels have access to Profit Benchmarks as part of their base Northbeam accounts. It is no additional charge to use Profitability Benchmarks.
Does setting benchmarks apply them to the view of every user in my Northbeam account?
- Yes. At this time, any updates to Profit Benchmarks are spread across your account.
How does benchmarking work across multi-region accounts?
- At this time, you cannot apply single benchmarks across multiple regions. This is likely not a good idea anyway as each region contains idiosyncrasies that would affect benchmark setting.
In the Adopt Benchmark stage, how does Northbeam calculate the potential lift these benchmarks would create?
- We calculate ROAS for your selected days and use that to calculate potential revenue across all the days in the date range you selected. So if your date range is six months, and hypothetically half of the days in that range are "out of benchmark" we would calculate the potential ROI if those days had hit the benchmark.
- So for example, the math would look like this, across two example days:
For a benchmark ROAS above 3.0:
Day 1: ROAS = 3.5 - This day is included in the revenue calculation.
Day 2: ROAS = 2.7 - Since this day is below ROAS target benchmarks, we would calculate the estimated ROAS and account for that in the total. (spend * ROAS for selected days)
Even if you use another benchmark like CAC, we still use ROAS to calculate your potential returns but filter based on your chosen metric.
Please reach out to your Media Strategist, Customer Success Manager, or contact Support if you have any questions.
Updated 11 months ago