
🏠 Overview Home Page
This is your Northbeam starting point.
The Overview Home Page is the first page you see when you log into Northbeam.
The dashboards here are built to visualize the KPIs that are most important for your business and give you a sense of your overall business metrics on any given day.
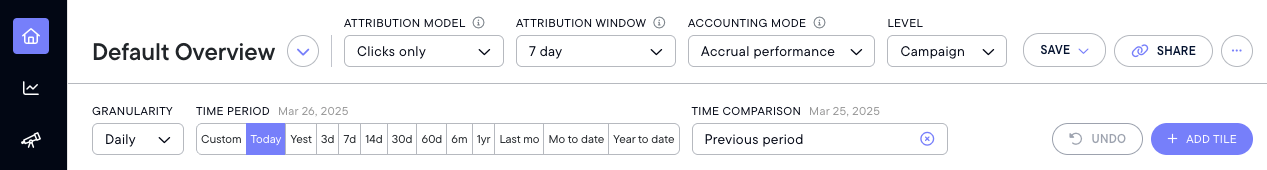
- Attribution Models
- Clicks-Only: credit is divided equally among all touchpoints, excluding bottom-funnel touchpoints (direct search, branded search, email, SMS).
- The credit that would normally be given to bottom-of-funnel channels is reattributed equally to top-of-funnel channels (linear).
- First Touch: credit is fully given to the first touchpoint.
- Last Touch: credit is fully given to the last touchpoint.
- Last Non-Direct Touch: credit is fully given to the last touchpoint, excluding direct site visits.
- This attribution model matches up closest to what most platforms report as "last click."
- Clicks-Only: credit is divided equally among all touchpoints, excluding bottom-funnel touchpoints (direct search, branded search, email, SMS).
- Attribution Windows
- 1-Day Click (common attribution window)
- 3-Day Click
- 7-Day Click (common attribution window)
- 14-Day Click
- 30-Day Click (common attribution window)
- 90-Day Click
- LTV (Lifetime Value)
- Accounting Modes
- Cash Snapshot: best for reporting purposes and budget-setting
- This matches most to what you see in your Shopify or your backend e-commerce software.
- Accrual Performance: best for daily media buying decisions
- Cash Snapshot: best for reporting purposes and budget-setting
- Granularity: The level of detail on your metrics can be seen Monthly, Weekly, or Daily, allowing for a broad-scope analysis of performance.
- These various views help teams optimize daily operations while giving executives a broader, more strategic view over time.
- Time Period: The date range you want to analyze.
- Time Comparison:
- Previous Period (common)
- Same period, prior year
- Same period, different year, or
- Customize
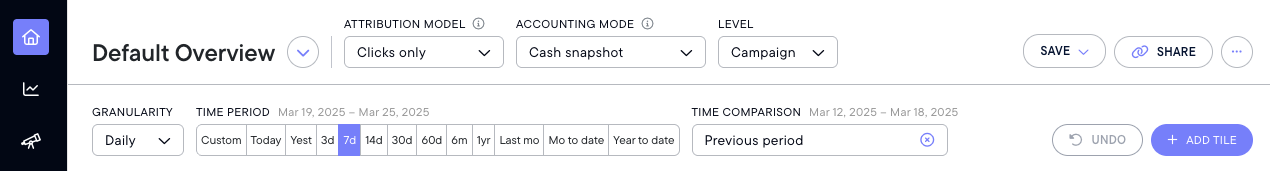
Recommended Dashboard Settings:
- Attribution Model: Clicks-Only
- Attribution Window: 1 Day, 7 Day, 30 Day (this depends on how long your sales cycle is as well as your price points)
- Accounting Mode: Cash Snapshot
- Granularity: Weekly
- Time Period: Monthly (to see month over month on a weekly basis)
- Time Comparison: Previous period
Overview Page Video Walkthrough
Full Customization
You are able create or rearrange tiles on your Dashboard to showcase KPIs like ROAS, CAC, and transaction data.
- You can change your metrics, rename views, and save customized dashboards for quick access.
- These views are shared across your team.
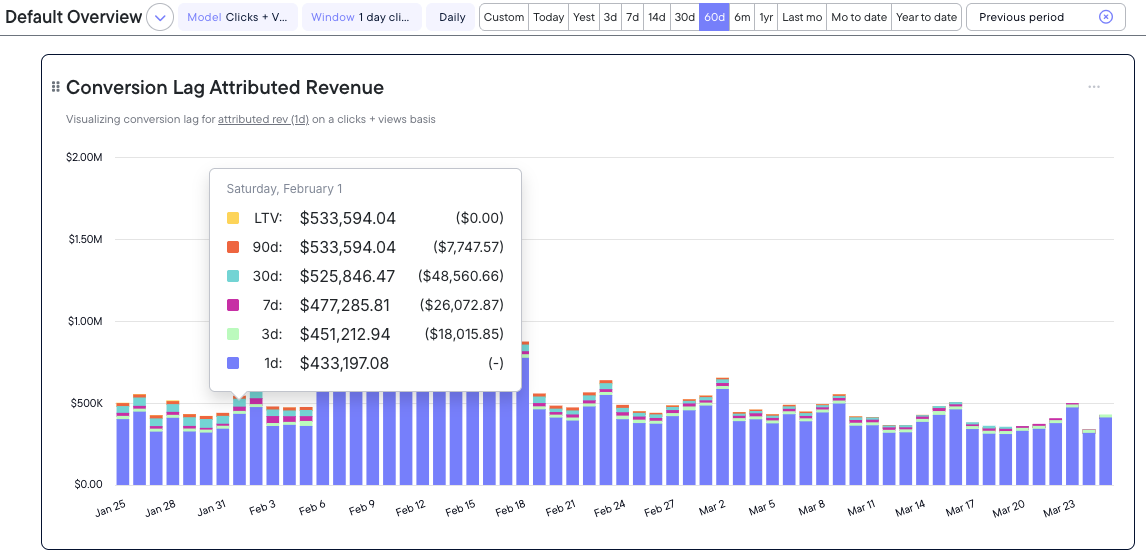
Conversion Lag
Under +ADD TITLES, there are various options to choose from, one of which is Conversion Lag charts.
- These charts allow you to show true marketing dollars over time and answer the questions what am I spending today? and what impact will this have on revenue in the future?
- Marketing touchpoints that accrued today can influence revenue that happens tomorrow.
- Most businesses will utilize a 7-90 Day Window. Your precise window depends on your consideration period:
- How long is your sales cycle?
- How long does it take on average for someone to make a purchase decision?
Recommended Conversion Lag Settings:
- Attribution Mode: Clicks + Modeled Views
- Attribution Window: 1 day click/1 day view
- Accounting Mode: Accrual performance
- Granular: Daily
- Time Period: 60 days
ℹ️ Businesses with higher price points may see a longer conversion period, so balance your payback period by answering the following:
- How long can you wait before you see that revenue come back?
- How long does it typically take someone to make a purchase decision?
✅ Let's keep going
Now you've gotten familiar with the Overview Home Page, you're ready to move forward.
Next is the Attribution Home Page, where you'll learn how Northbeam tracks the full customer journey.
Updated 10 months ago