
🚀 Metrics Explorer Quickstart Guide
First time using Metrics Explorer? Start here.
Below is a step-by-step guide to help you run your first-ever Metrics Explorer correlation analysis. Follow along with each step and you'll finish this process with a real insight!
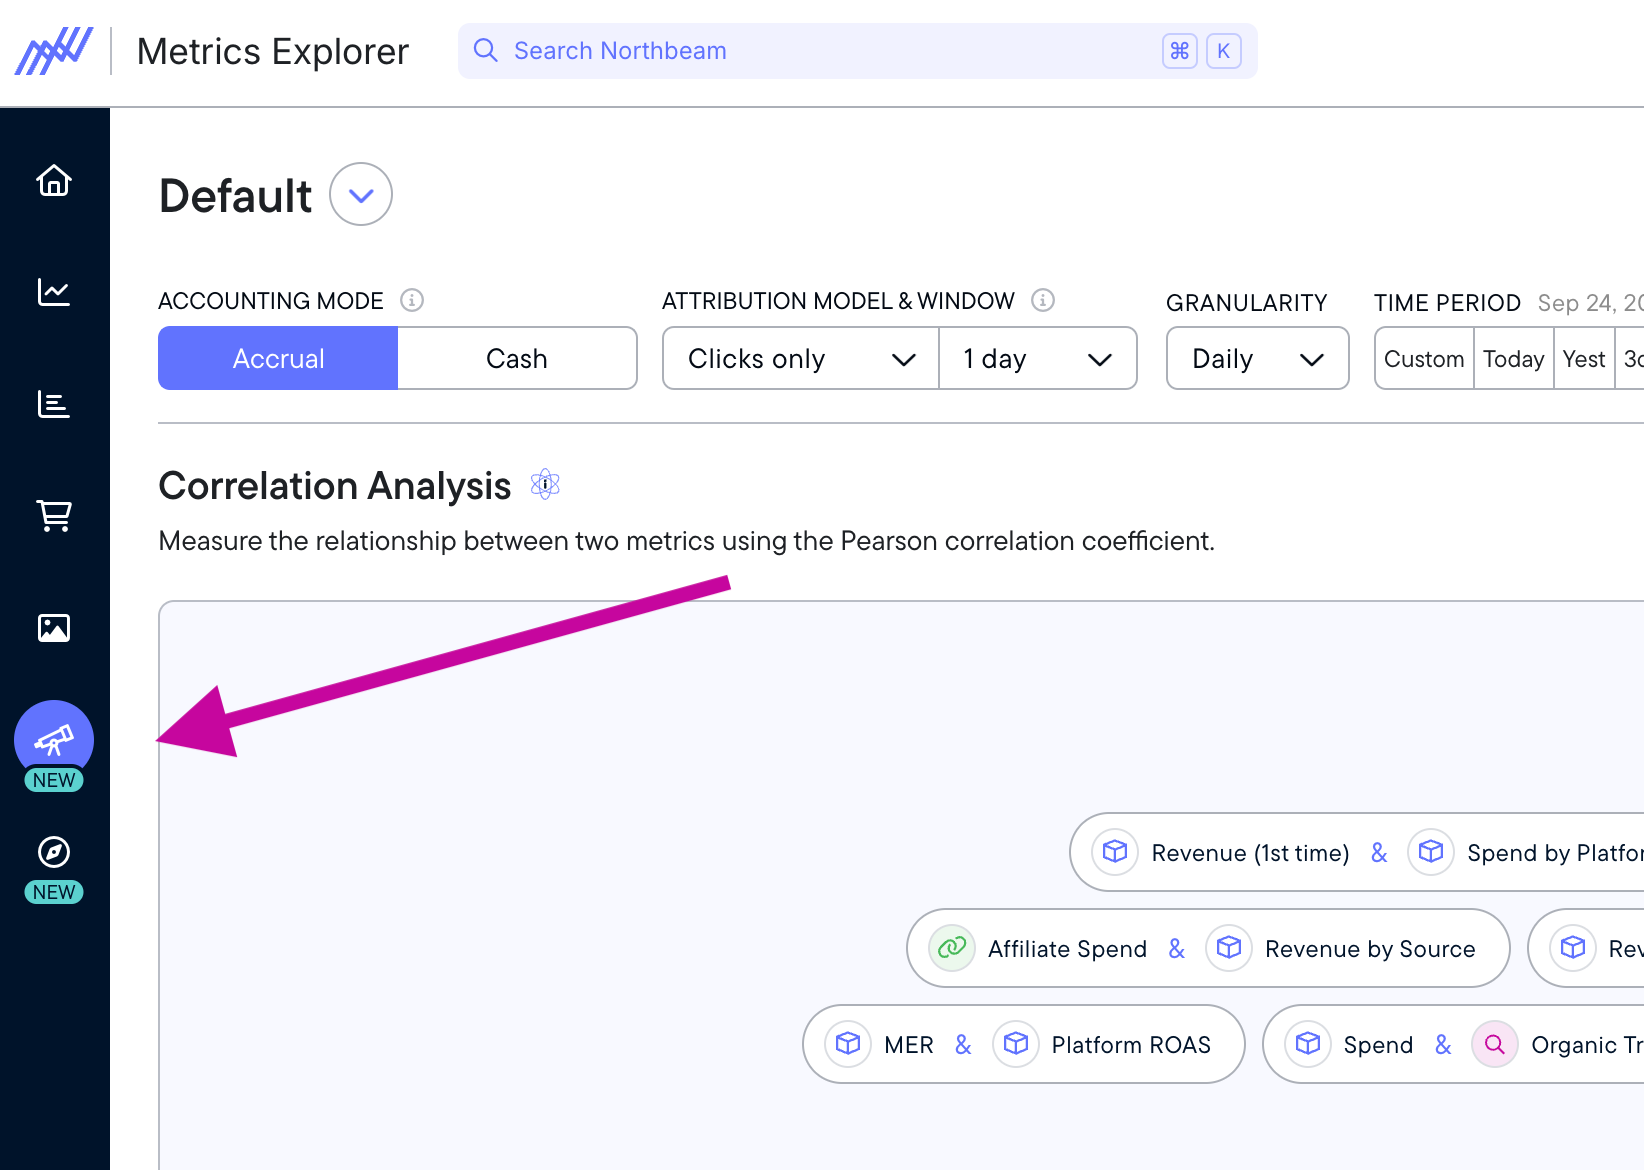
Step 1: Navigate to Metrics Explorer inside the Northbeam dashboard.
Click the telescope icon on the navigation bar on the left to find Metrics Explorer.
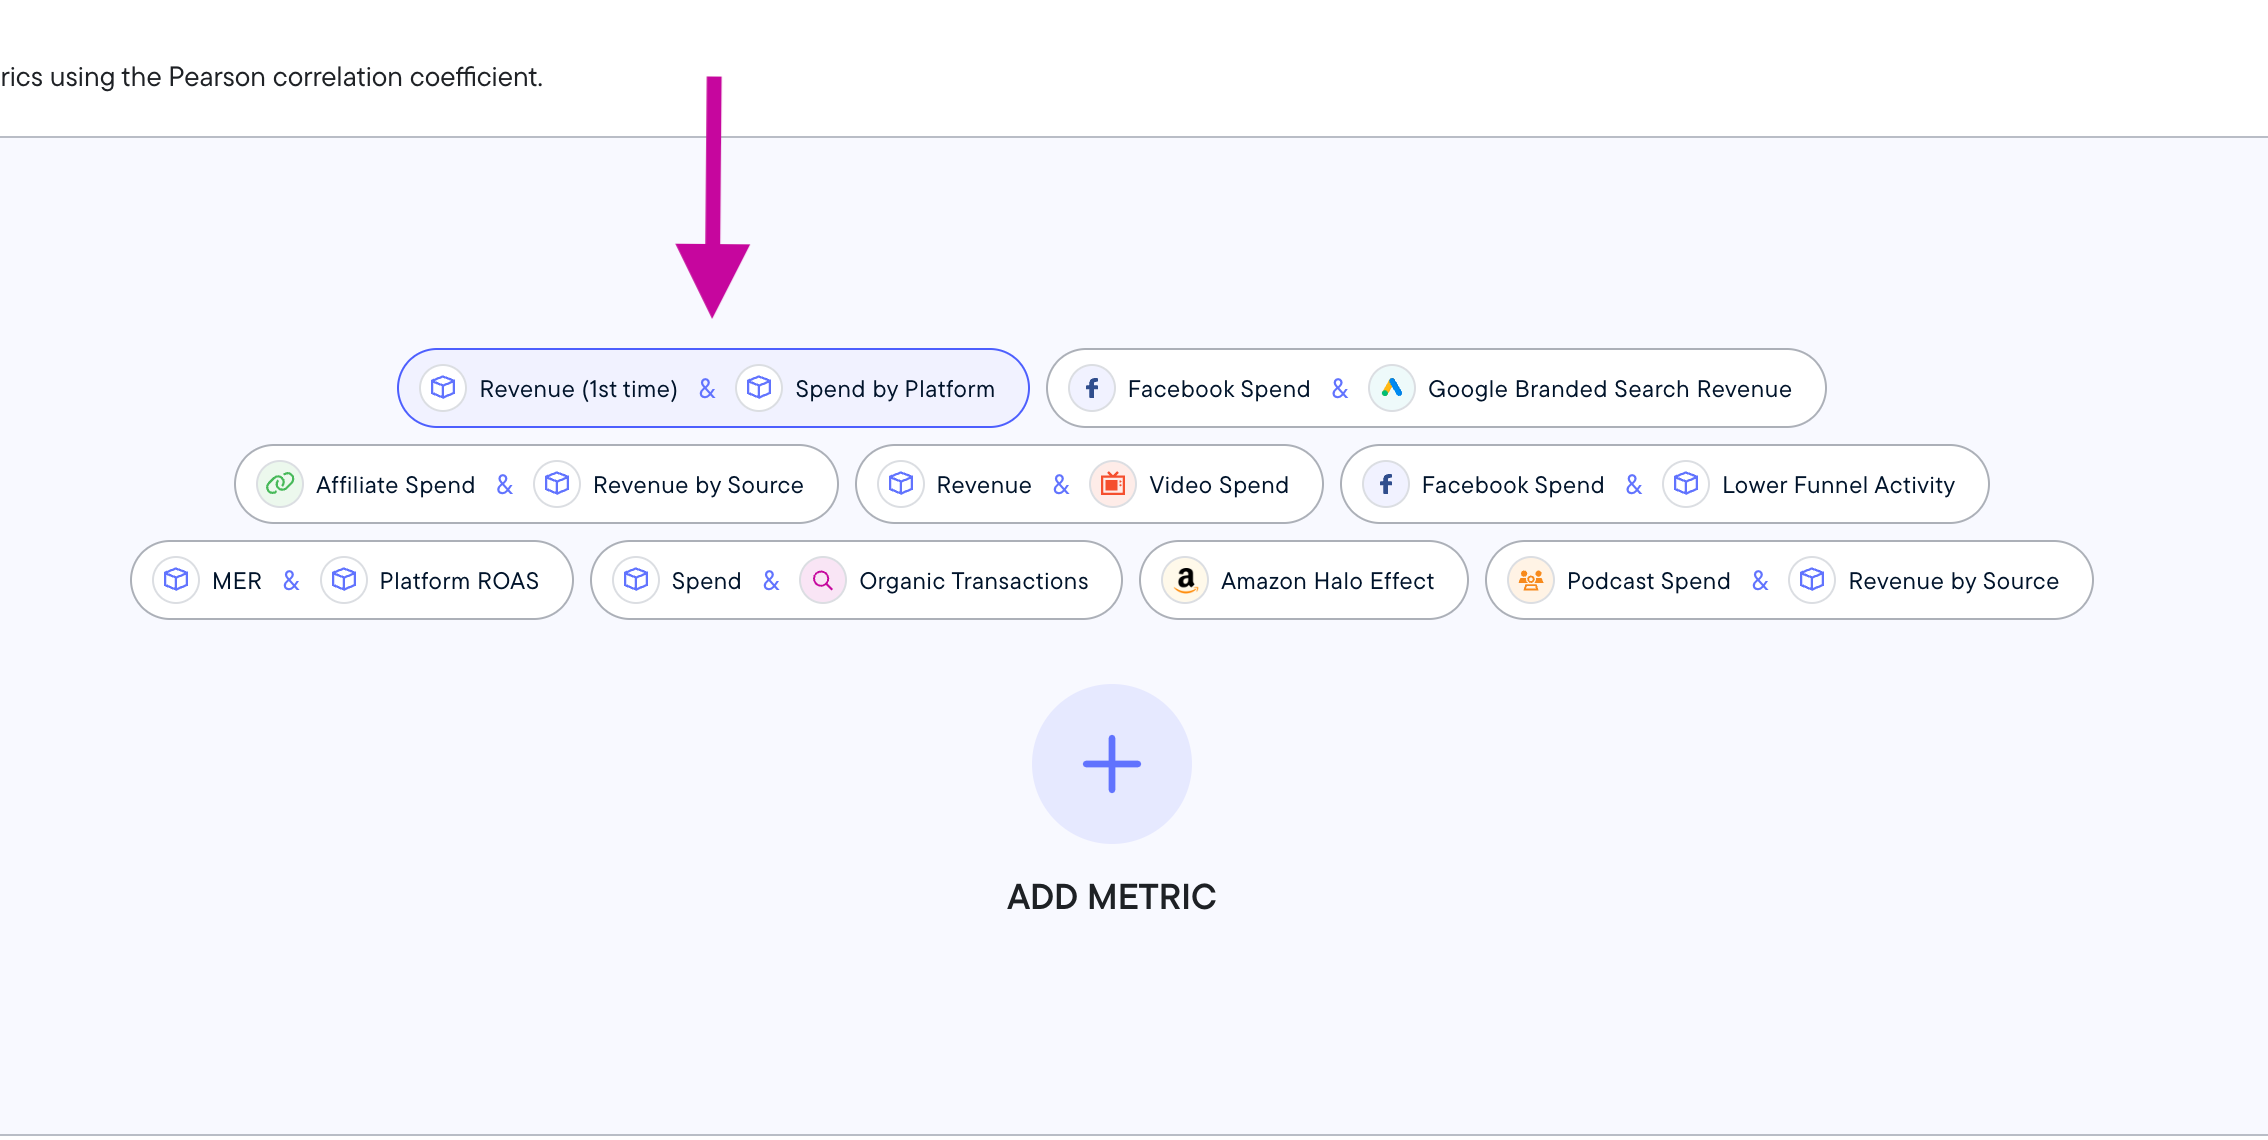
Step 2: Select the first "quick start" link at the center, titled "Revenue (1st time) & Spend by Platform."
These quick links are designed to help you get started fast, and contain ideas from our most common correlation analyses. Feel free to start with these and customize them to your specific needs.
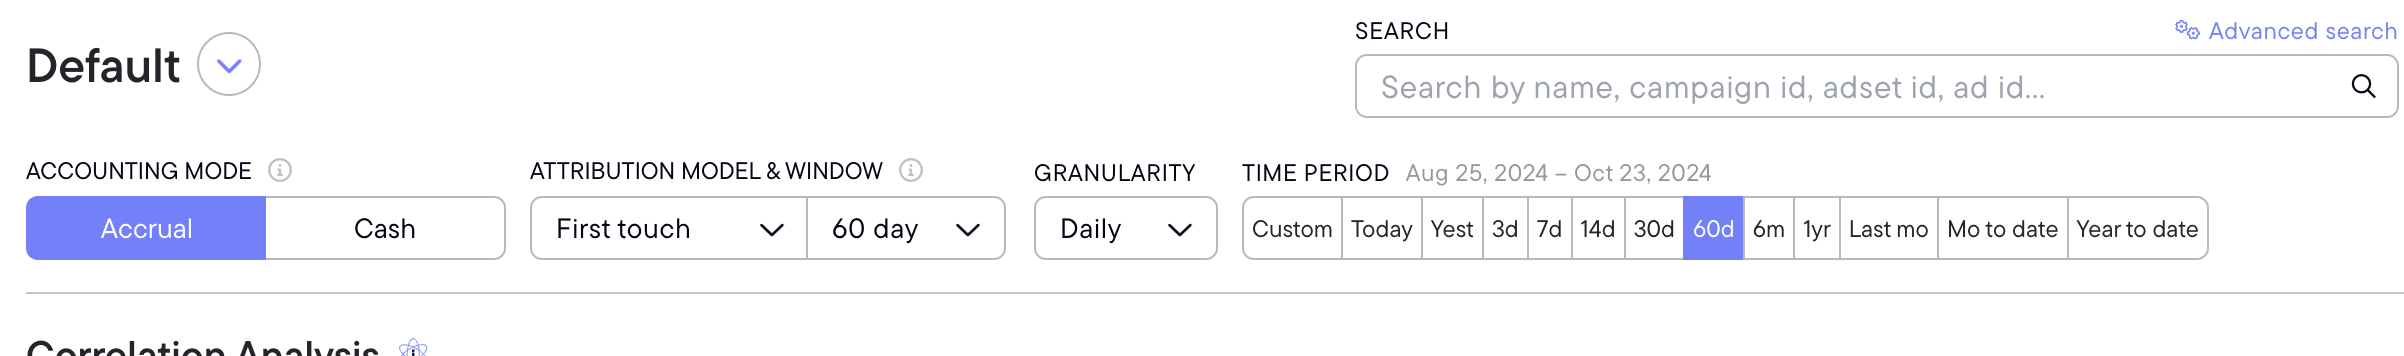
Step 3: Adjust your filters and attribution windows.
For this example, let's select:
- Accounting mode: Accrual
- Attribution model & window: First Touch, 60 days
- Granularity: Daily
- Time period: 60d (60 days)
Once you choose these filters, the correlation tiles will update. This selection of filters will help us identify which spend on these channels is driving strong first-touch revenue.
Step 4: Analyze your results!
Next, let's look at the correlation tiles in this example from a real business.
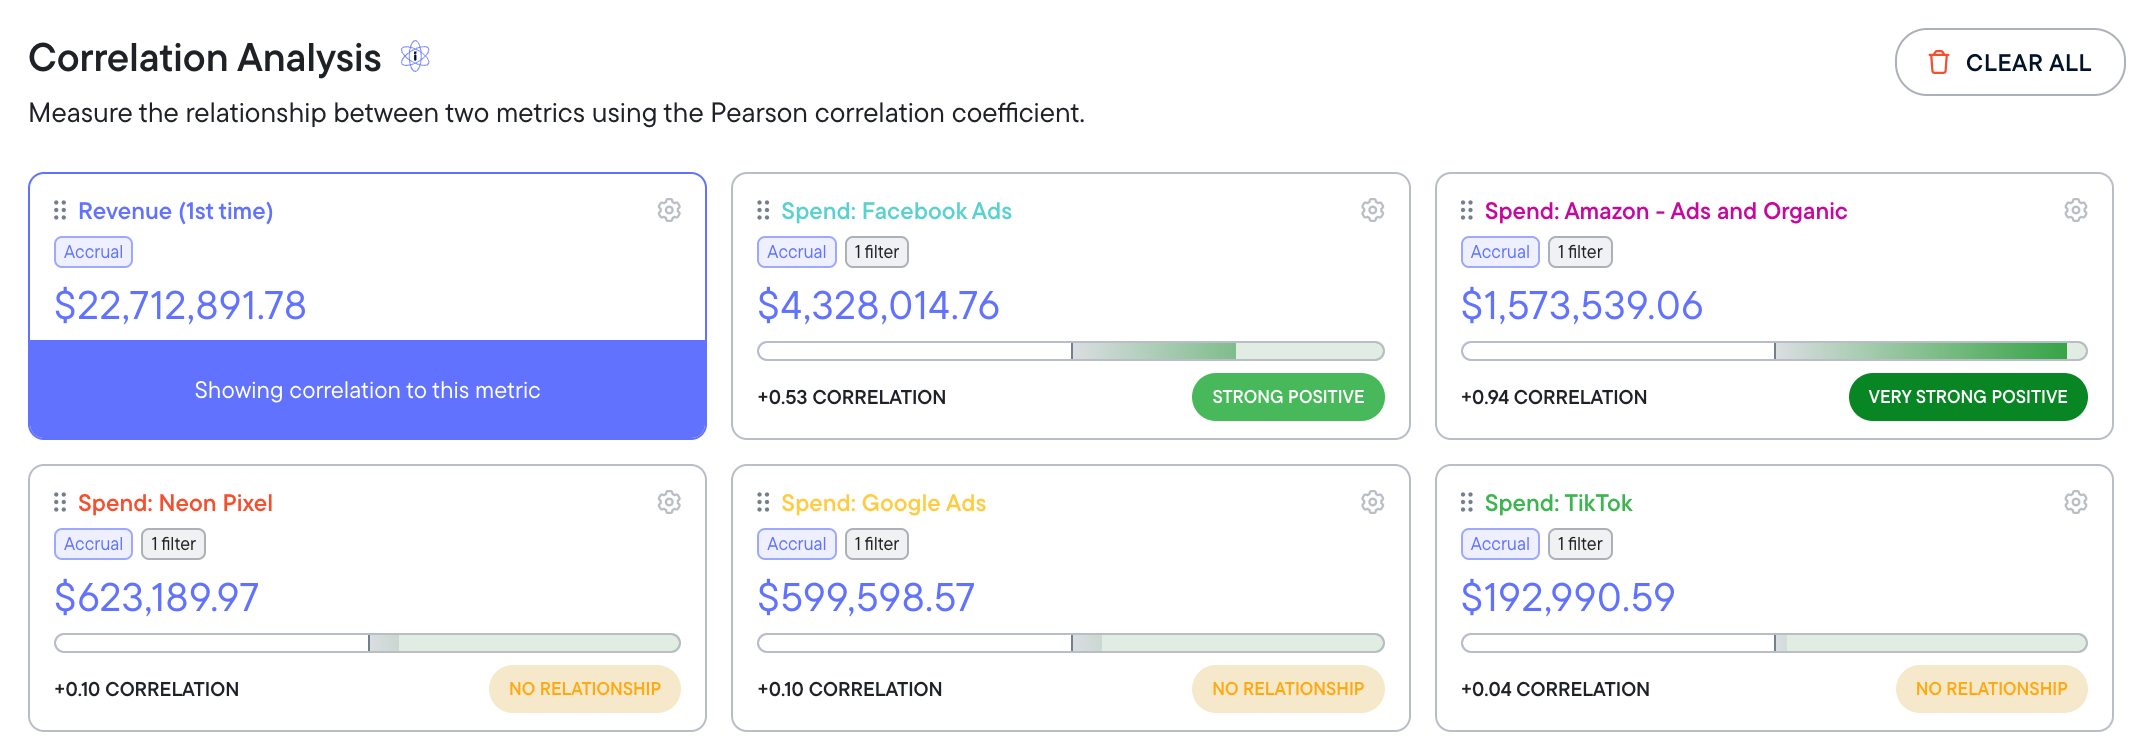
In this example, you can see that over the last 60 days, given a large first-touch lookback window, 1st time revenue is very strongly positively related to Amazon Ad spend.
To a lesser degree, there's a similar relationship with Facebook Ads spend. There's no correlation between revenue and spend on Neon Pixel, Google Ads, Or TikTok for this business over this time period.
Which relationships exist in your dataset?
But it may feel backwards to see how "spend" changes against revenue. Let's check this relationship from both angles.
Step 5: Click a different metric to see the relationships from a different angle.
Click the correlation tile of the most strongly correlated metric in your dataset.
In the example, I would click the "Spend: Amazon - Ads and Organic" tile, as seen in this image. This changes "Spend: Amazon - Ads and Organic" into the primary metric, meaning all the other tiles now show their correlations to this metric instead of the original tile (Revenue 1st time.)
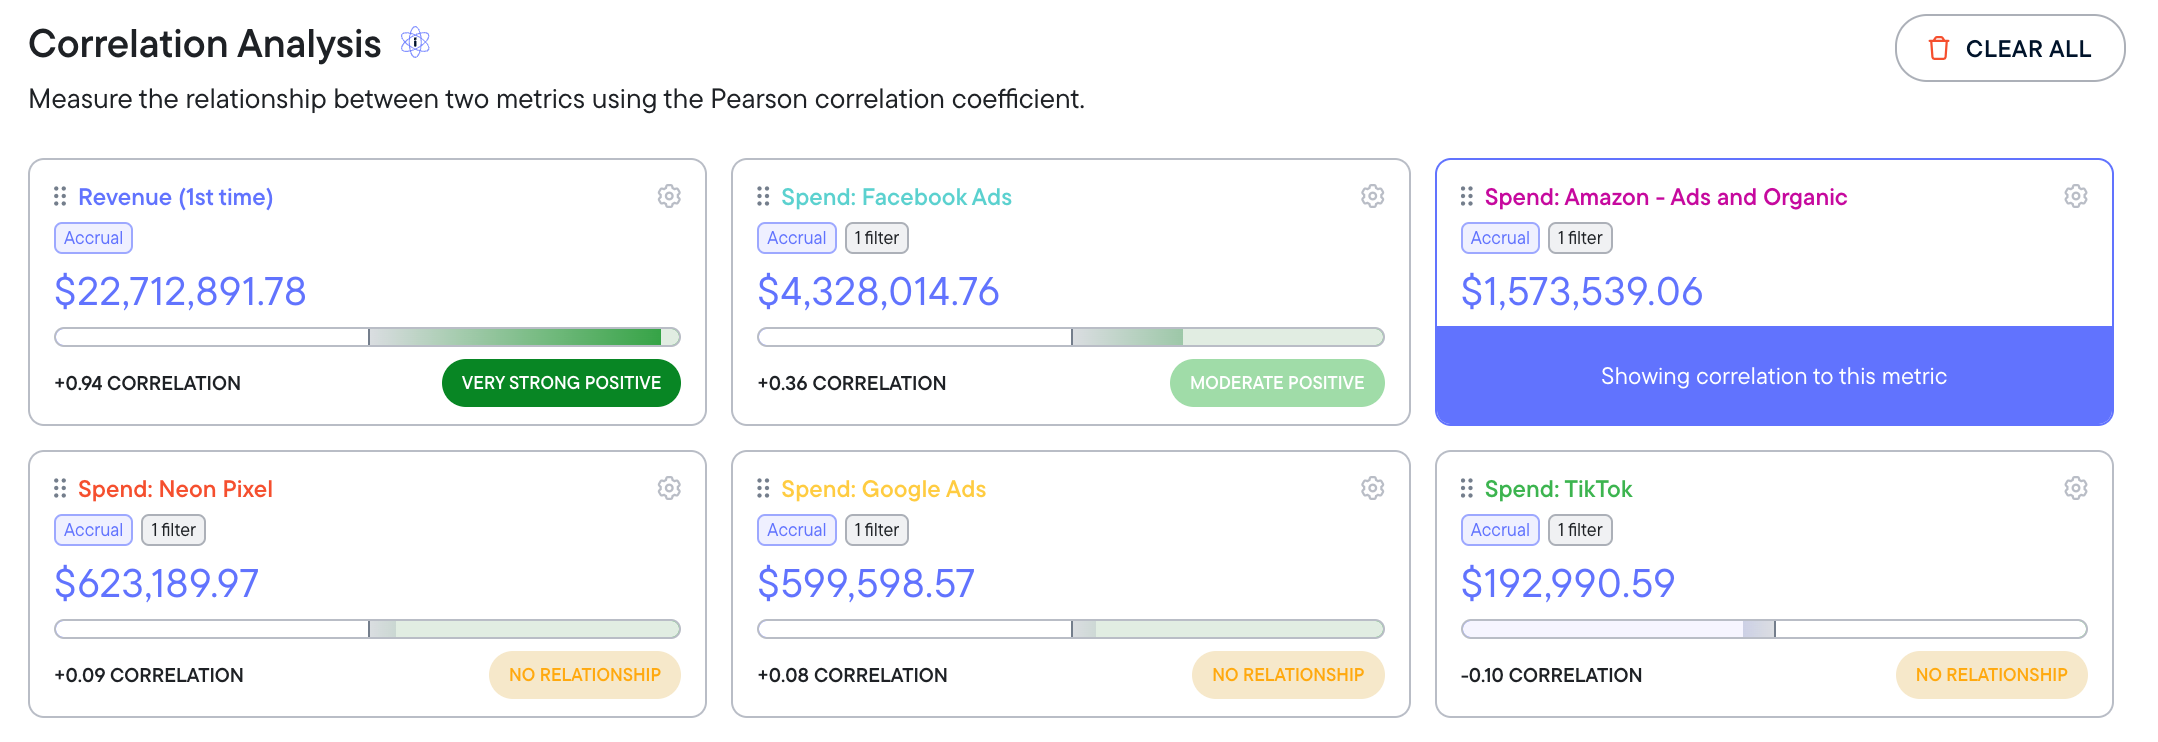
As we can see, there's a very strong positive relationship between Revenue (1st time) and Amazon Ads spend.
This analysis suggests that increases in Amazon Ad spend will drive up first-time revenue. However, it doesn't guarantee that result - remember, correlation does not imply causation.
When interpreting correlations, be sure to examine every relationship from multiple angles, metrics, and perspectives. This helps to prevent you falling into the "correlation does not imply causation" fallacy and strengthens your analysis. It's good statistical practice!
Step 6: Look at the charts to identify visual trends.
Looking at the chart visuals can assist you in validating the relationship between metrics - and identifying outlier moments you might need to account for.
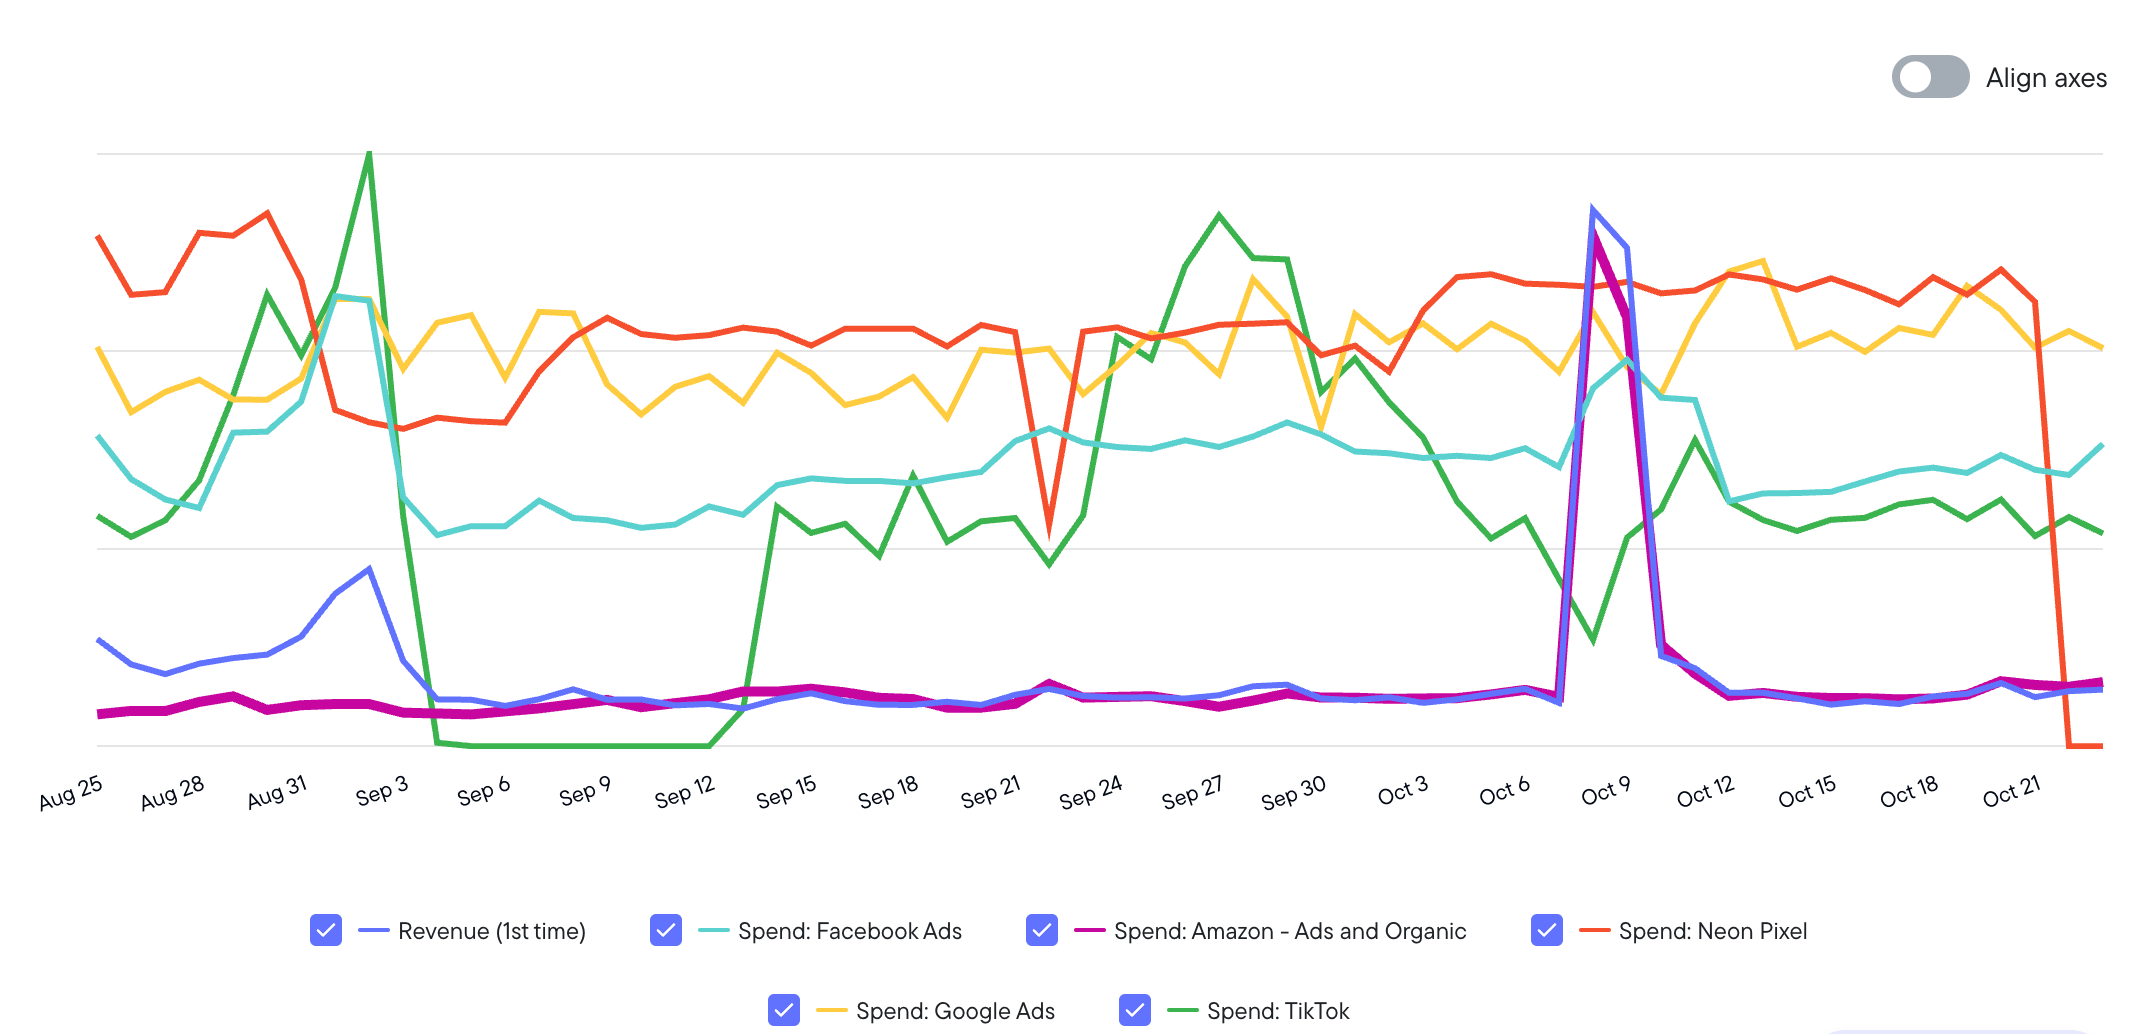
In this visual, we can see a few strong outliers. The green line, which represents TikTok Spend, dropped to zero for several days in September. This suggests that while there doesn't appear to be any relationship, the TikTok data isn't very consistent either. This is worth deeper analysis to understand how TikTok spend actually affects revenue.
The Amazon spend, however, saw a huge spike around October 9. This could be an early Prime Day sale. The major success on that specific day could be enough to influence the whole analysis.
When using Metrics Explorer, be sure to have access to the wider context of your marketing strategy. Know what product launches, promotional periods, or holidays might exist in your selected time range. This can help you limit confounding variables.
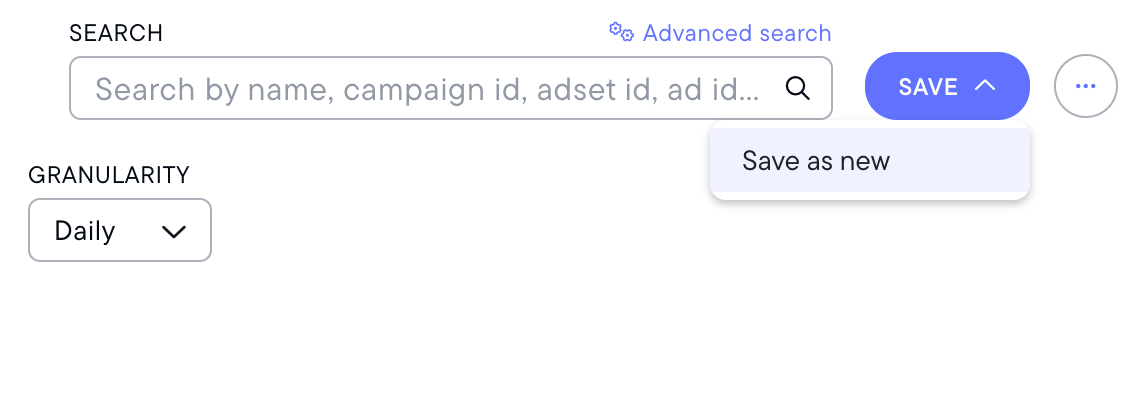
Step 7: Save your view for easier access later.
In the top right hand corner of the Metrics Explorer screen, select "Save -> Save as new" to save your existing view for future reference.
Congratulations! You just made your first analysis on Metrics Explorer!
Let's look at some best practices next.
Updated 10 months ago