
💰 Sales Attribution
Your hub for day-to-day decisions
What is Sales Attribution?
The Sales Attribution page is the most utilized page on Northbeam, for good reason.
Here you have a complete picture of how your marketing is performing across all channels, and you can do your daily campaign optimization.
The Sales page is made of three parts, all filtered by the Views and Filters discussed on the previous page.
What can you do with Sales Attribution?
- Optimize your ad campaigns daily. This is your home base for all your channels.
- Identify how profitable your marketing is across channels. Immediately see which ads to scale and which to cut.
- Run quick analyses on customer acquisition, sales, and more. Utilize quick filters to understand the state of your marketing.
The Revenue Chart
This is a dynamic chart that will stack and layer your metrics over the time frame you select. This is the fastest way to identify patterns and changes in your data.
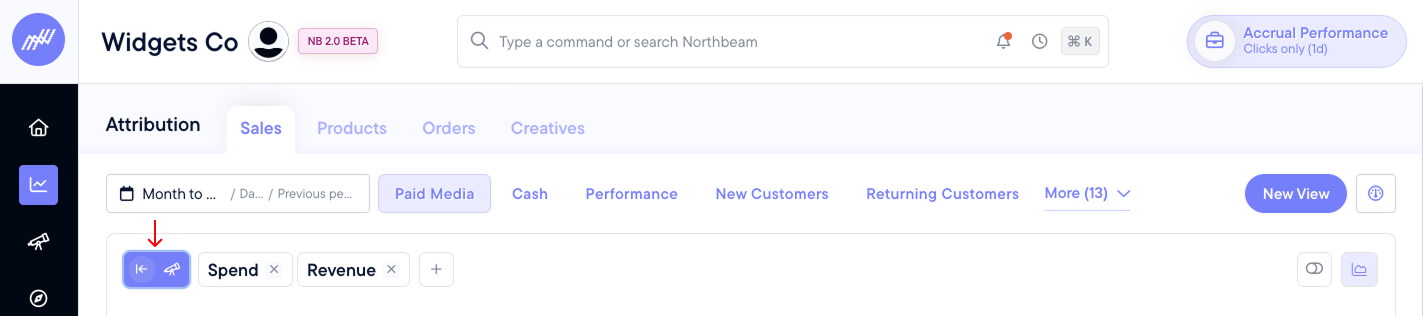
At the top of the chart, you can see each of the metrics included in the chart. Click the plus sign to add more. As you do this, remember it will adjust your current View.
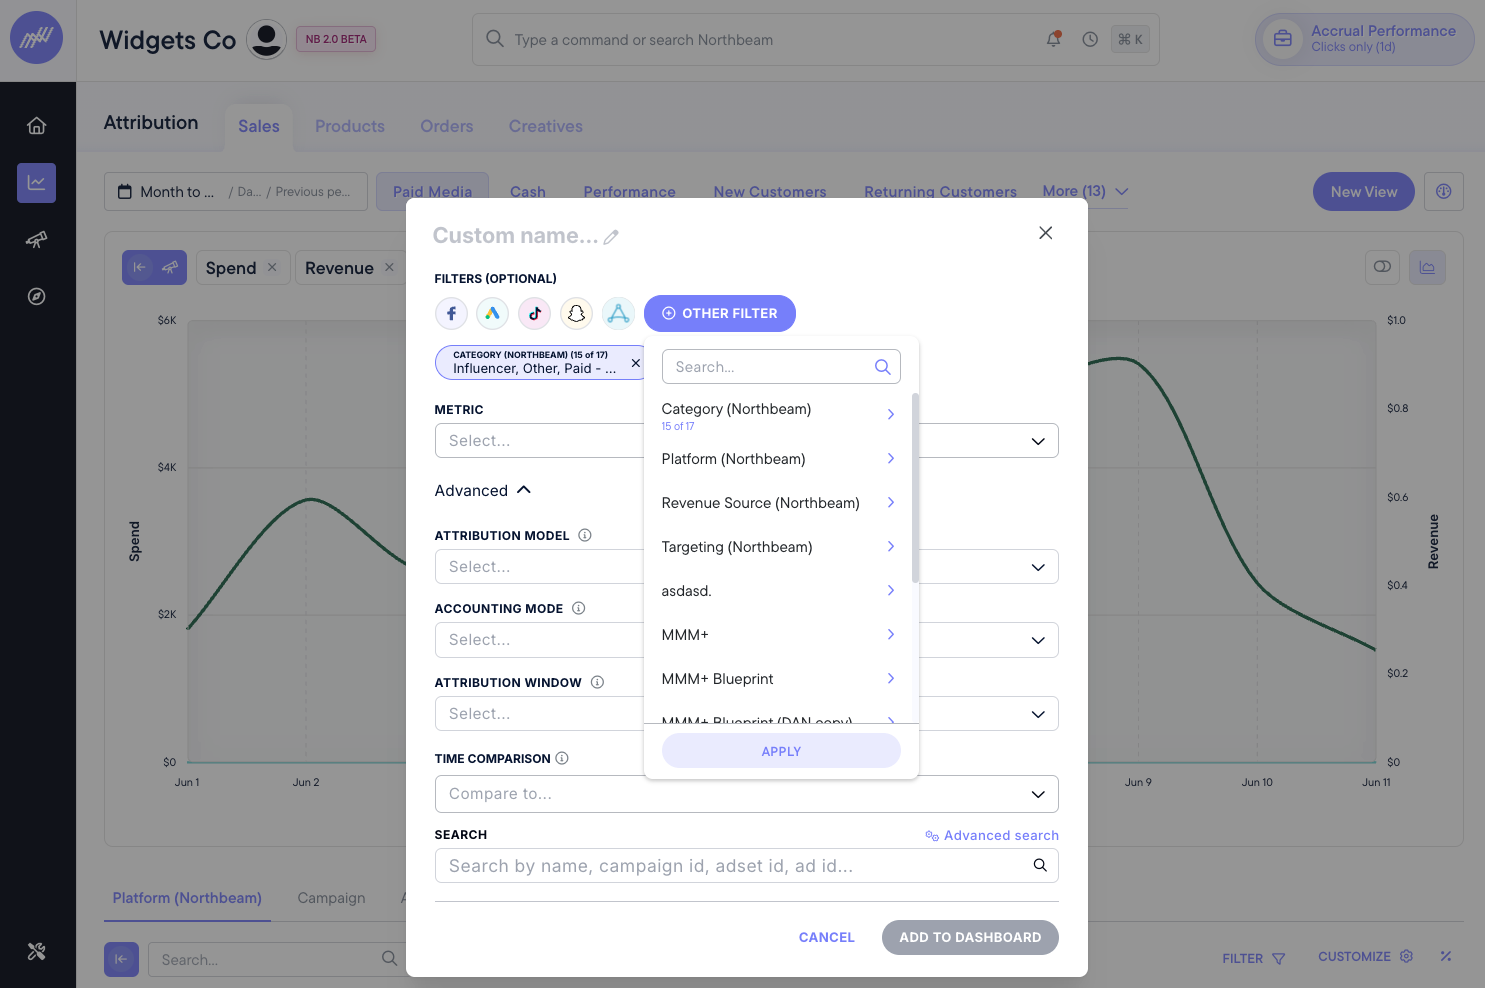
You can also change the chart type, align the axes, and select other options.
On the left side of the Revenue Chart, you’ll see the Metrics Explorer button in purple - this will open a quick popup of Metrics Explorer, comparing the correlation between the metrics currently in your chart.
This is what will pop out:
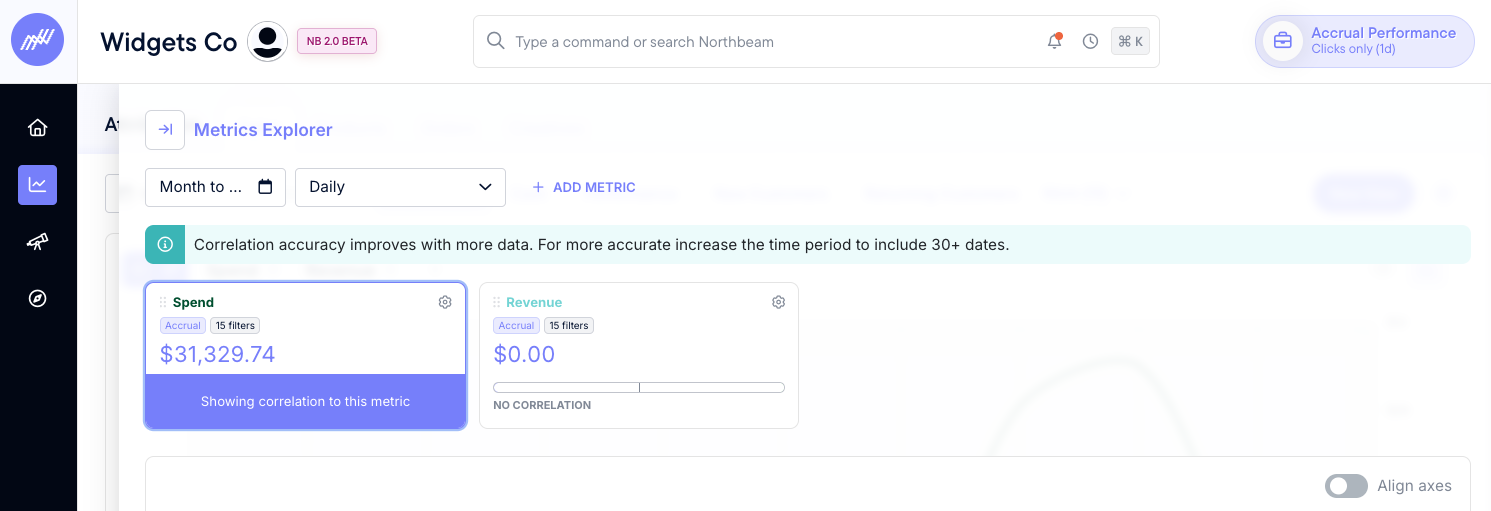
For more on Metrics Explorer, read here.This is one of Northbeam’s most powerful analysis tools for measuring the halo effect and top-of-funnel.
The Profitability Gauge
This “speedometer” reports the percentage of the ads visible in the current view that qualify as profitable, as defined by the Profitability Benchmarks you set.
What your ideal percentage should be depends on the benchmarks you set. Click the Profitability button to set your profitability benchmarks for your account.
You can easily select from the dropdown blended, new, or returning customers, allowing you to measure how profitably you’re acquiring across the funnel.
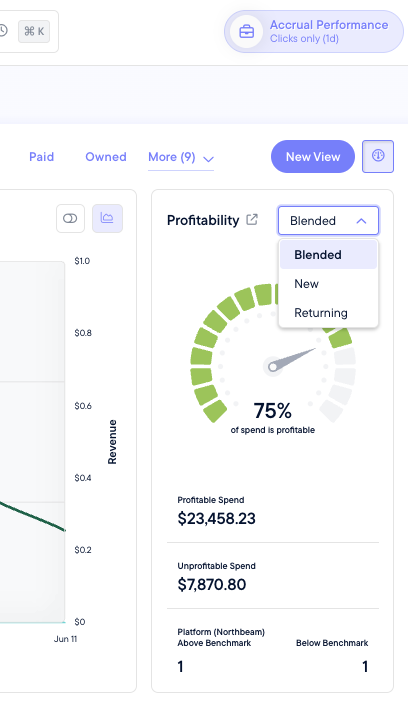
To view your Profitability in detail, look at the Revenue Table.
The Revenue Table
At the bottom of the page, you’ll see the Revenue Table. It has four tabs:
Platform: This shows aggregate performance across your advertising channels, platforms, etc. Your highest-level breakdown is here.
Campaign: This shows the performance for specific ad campaigns within the platform(s) you selected.
Adset: This shows the performance for the adsets you’ve selected from the platforms and campaigns you choose.
Ads: This shows the performance of specific ads within the platforms, campaigns, and adsets you choose.
The Revenue table is filterable in descending hierarchy from platform onwards.This means if you select a specific checkbox for a line on the Revenue table, it will filter all the following tabs in descending hierarchy.
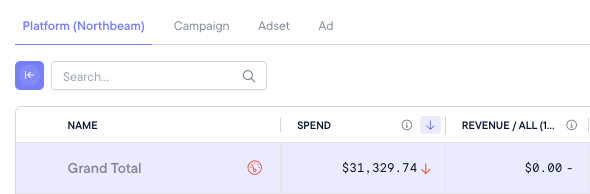
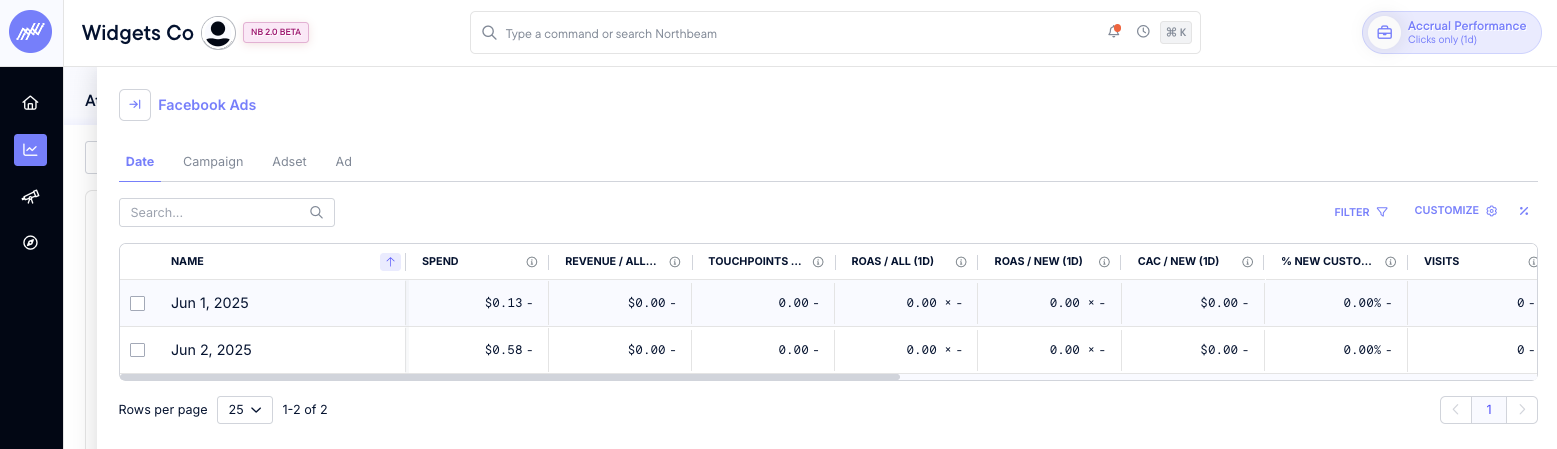
You can click any specific platform, ad, or adset to open a flyout showing daily level performance.
For example, by selecting Facebook Ads on the Platform tab, a flyout will automatically filter to ONLY show Facebook Ads campaigns, adsets, and ads on the other tabs.
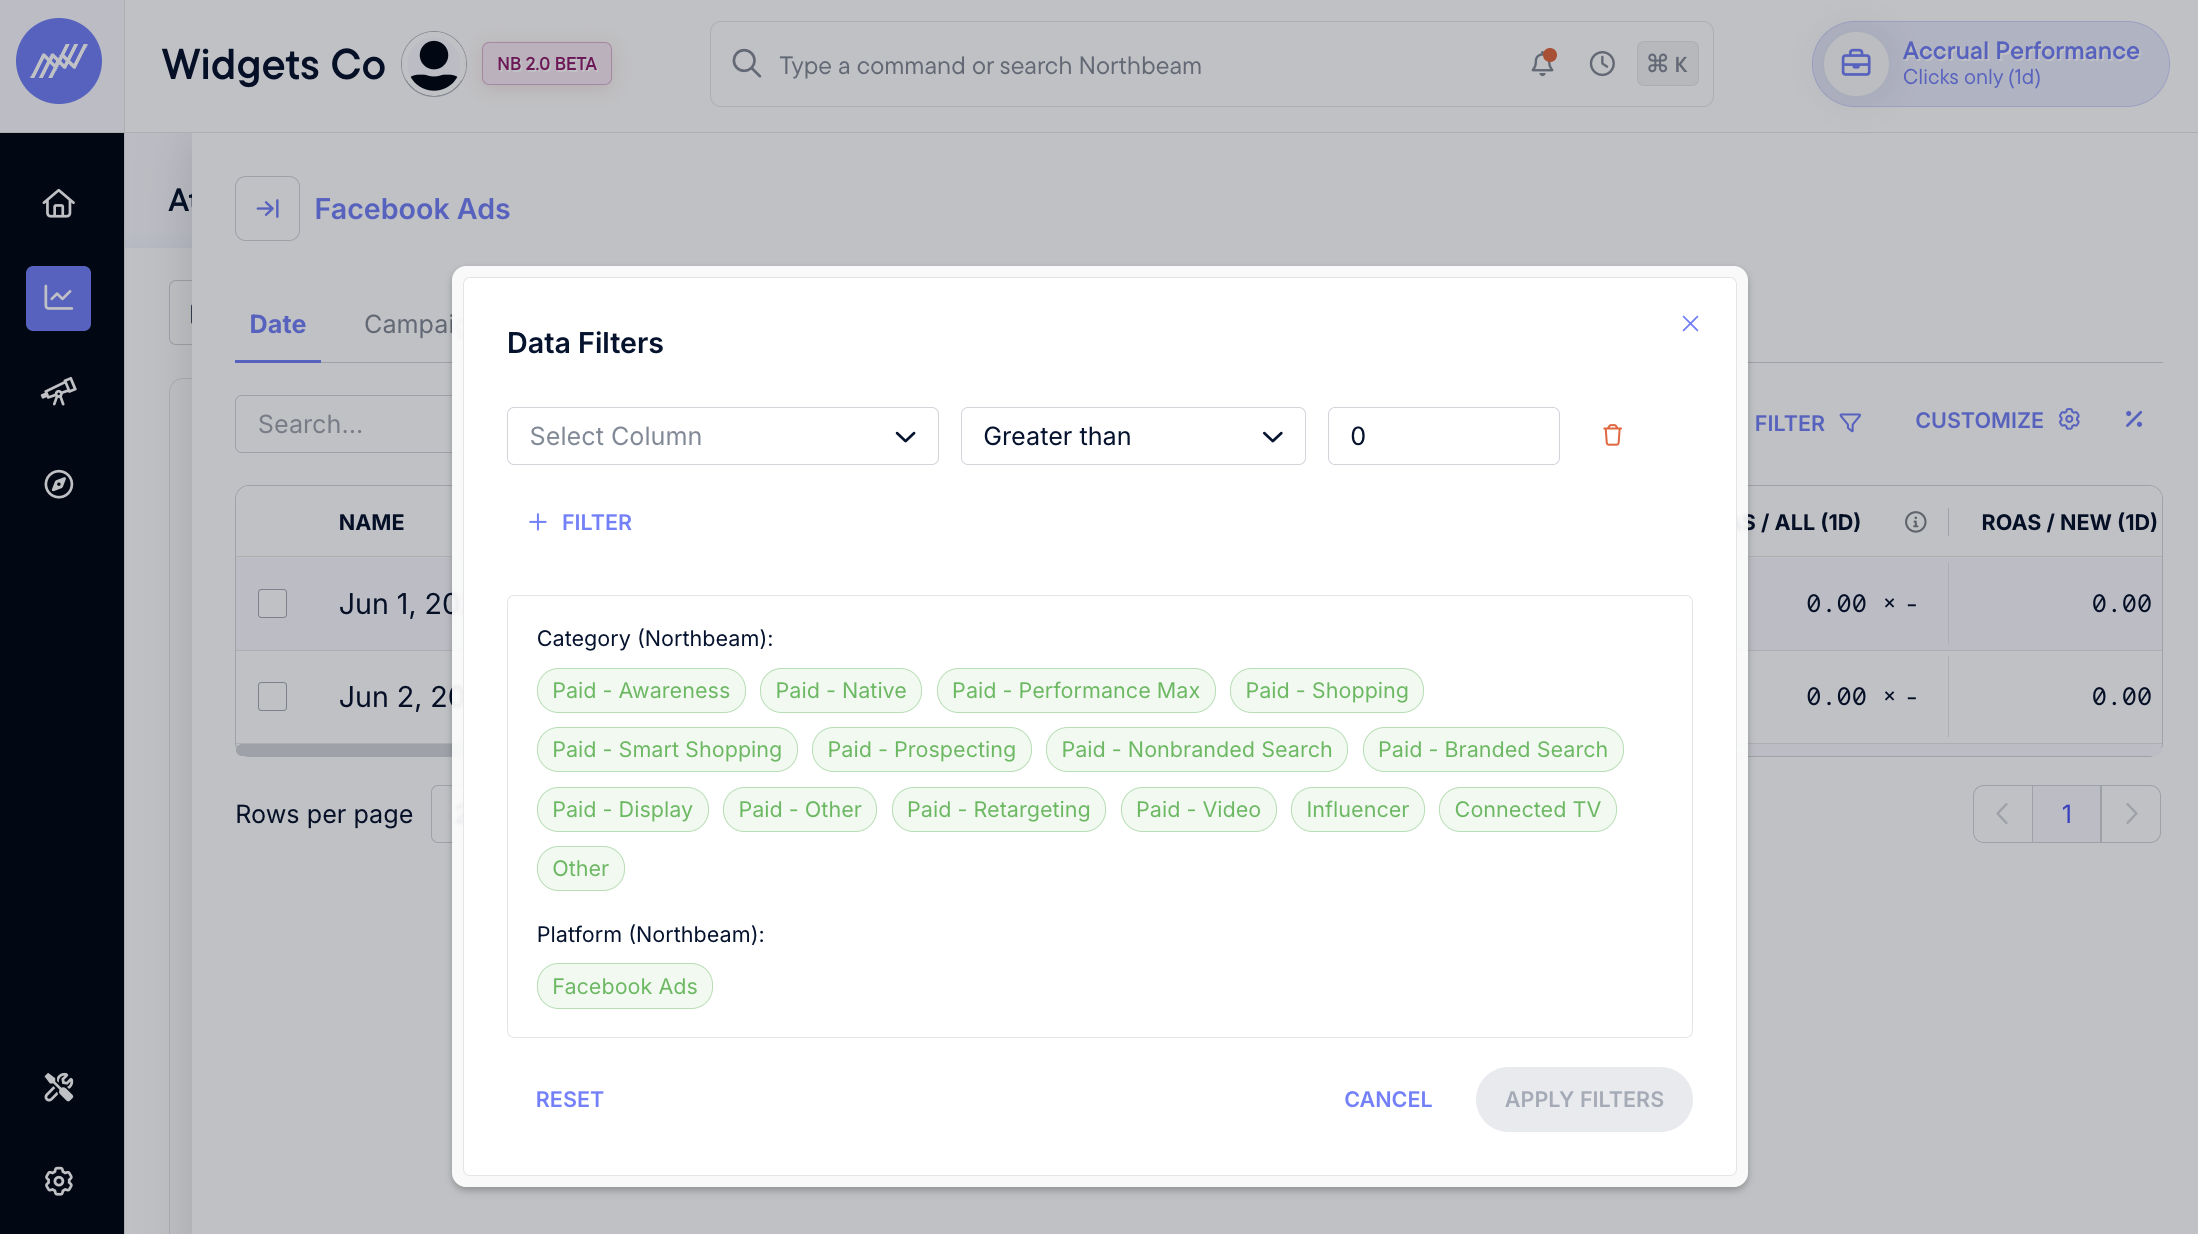
On the right, you can select filters, customize the visible metrics, and show percent changes for each compared to the time period you selected at the top of the page.
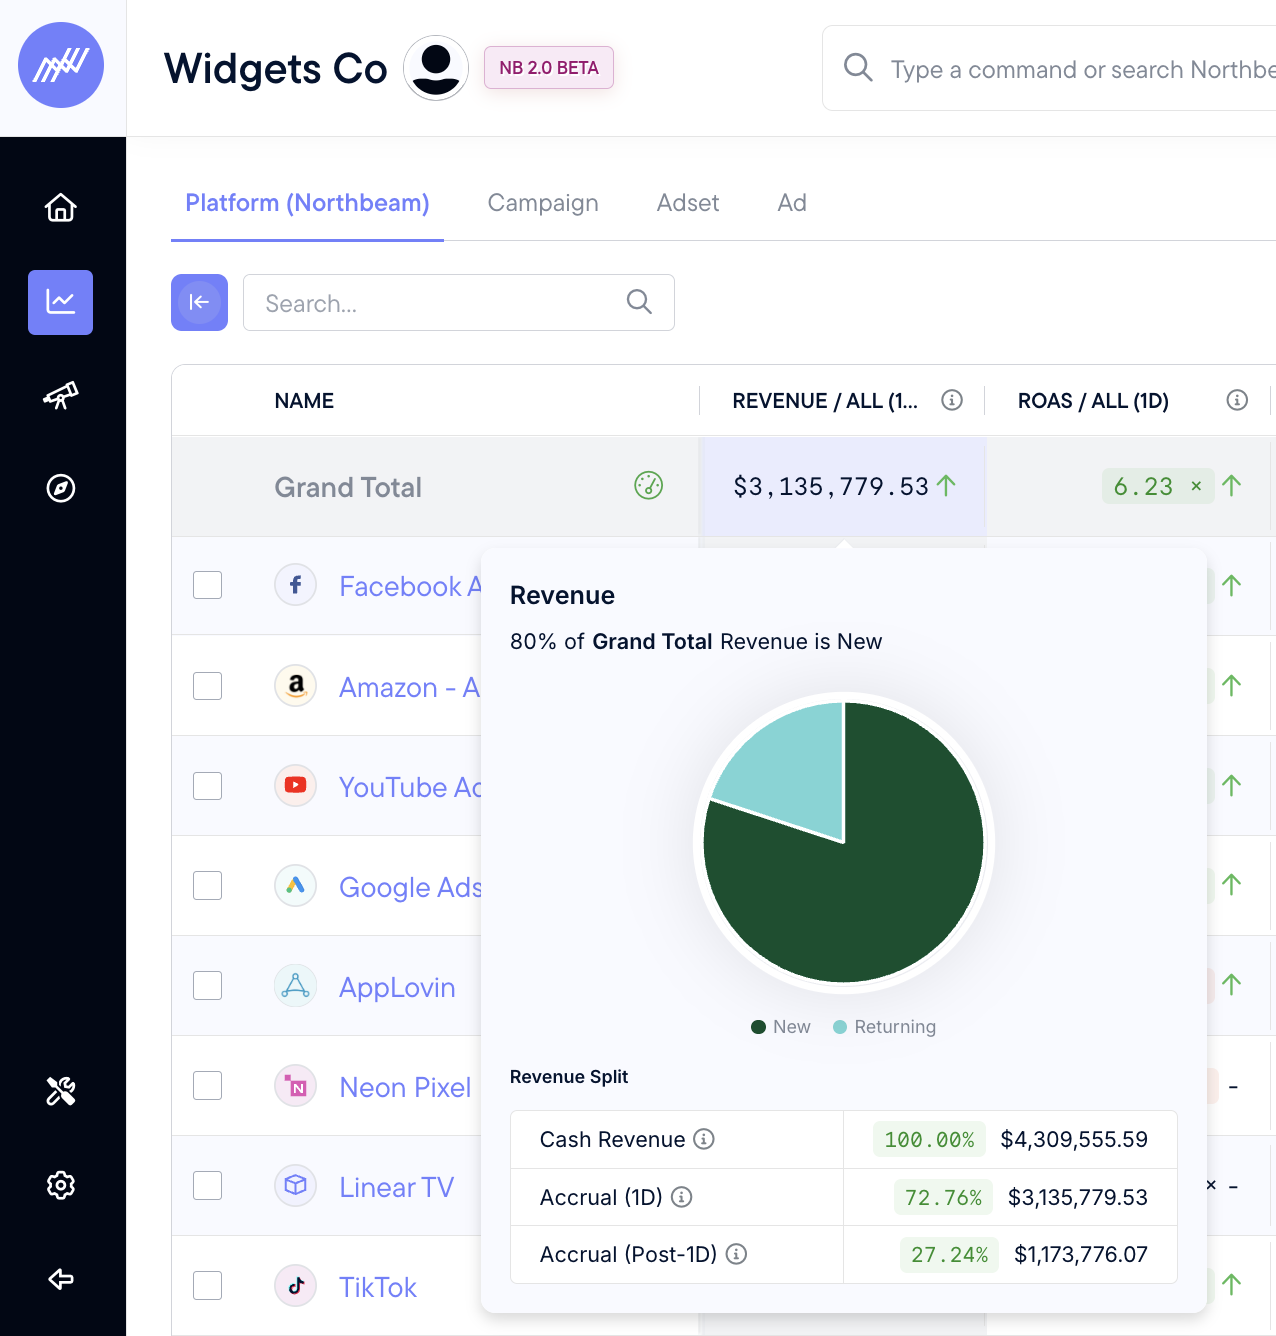
Hover over any colored metric in the Revenue table to open a tooltip showing more detail on that number.
Sales Attribution Walkthrough Video
✅ Wrapping up
This Sales Attribution page is essential for understanding your marketing efforts. Now that you have a handle on revenue performance, let's move on to Products Attribution.
Updated 7 months ago