
📊 Attribution 2.0
Welcome to Attribution 2.0! This is your operational hub.
Our latest update brings a faster, more intuitive, and more powerful experience to help you make smarter marketing decisions.
The Attribution Tabs are your primary toolbox for marketing analysis within Northbeam.
On these tabs, your team of media buyers, channel managers, and any related platform team can decide which platforms, campaigns, ads, and assets to adjust and improve for better performance.
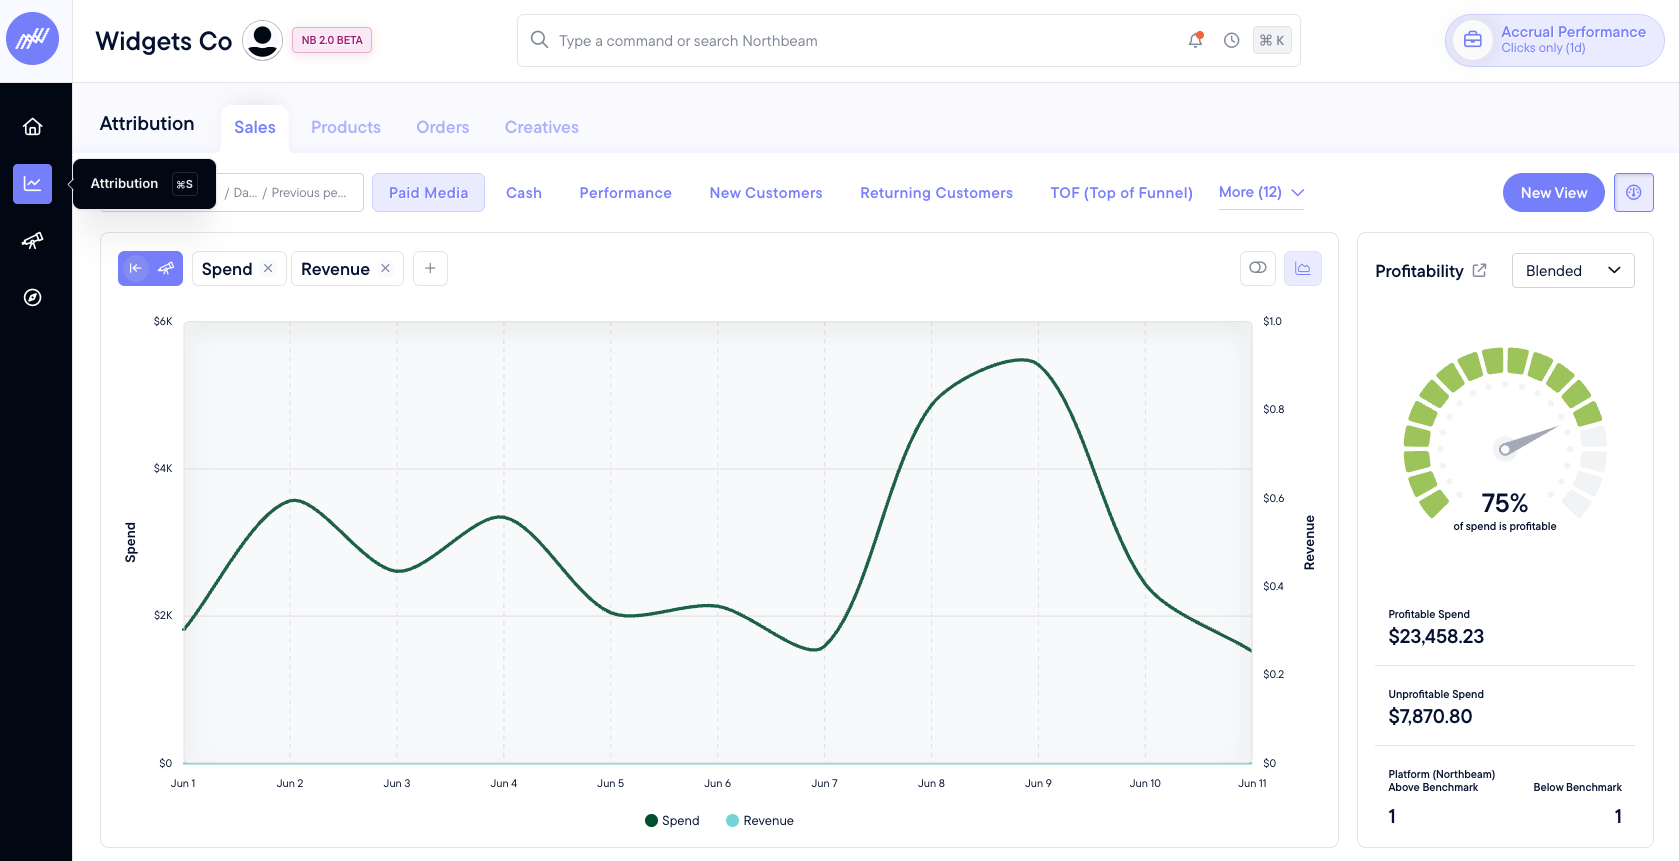
At the top of the Attribution page, you will see two layers of tabs: the Attribution Tabs and the Custom View tabs nested inside them.
You will also see a number of filters, such as Cash vs Accrual, time range, and attribution model. Understanding how these tabs, filters, and views interact is crucial for mastering Northbeam.
What can you do with the Attribution tools?
- Media buyers can identify which ads to scale and which to cut.
- Analyze all your campaigns and see how they interact.
- Find new products to scale via custom campaigns.
- Measure creative performance across channels.
- Identify profitable and unprofitable ads, campaigns, and channels.
Attribution Tabs
At the top of the Attribution page, there are tabs for specific analyses. Read more about each of those below.
Sales: A complete picture of how your marketing is performing across all channels for your daily campaign optimization.
Products: Shows you how well your ads are working in relation to the products they sell. This is data-driven merchandising for e-commerce businesses.
Orders: Allows you to understand what is driving purchases, and the data can also help understand the average number of touchpoints it takes someone to convert, as well as what the most common touchpoints are.
Creatives: Allows for granular insights into your creative performance. These detailed insights allow you to manage, iterate, and scale your high-converting campaigns.
On the right side of your screen, you will see Profitability, which cannot be utilized until you have passed the 90-day learning period with Northbeam.Learn more about Profitability Benchmarks here.
Custom Views
At the top of each Attribution tab, there’s a layer of buttons for customizing the metrics viewed in each Attribution tab. You can see several pre-made ones for quick filtering.
For example, on the Sales tab, the (TOF) Top of Funnel view will quickly demonstrate Spend and Visitors over the time period you select.
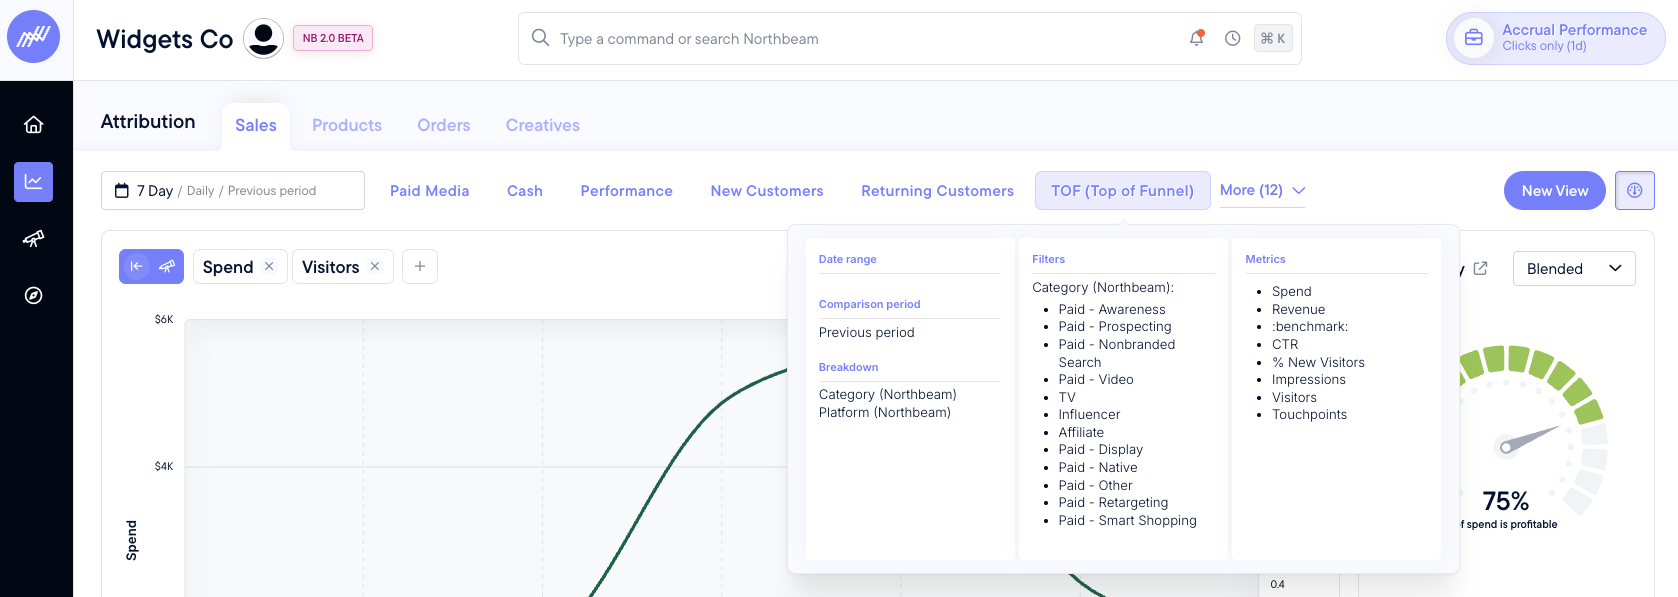
These premade Custom Views are a great way to get started with Northbeam.
Once you’ve customized a view, you can click the New View button at the top right corner to save that view for later.
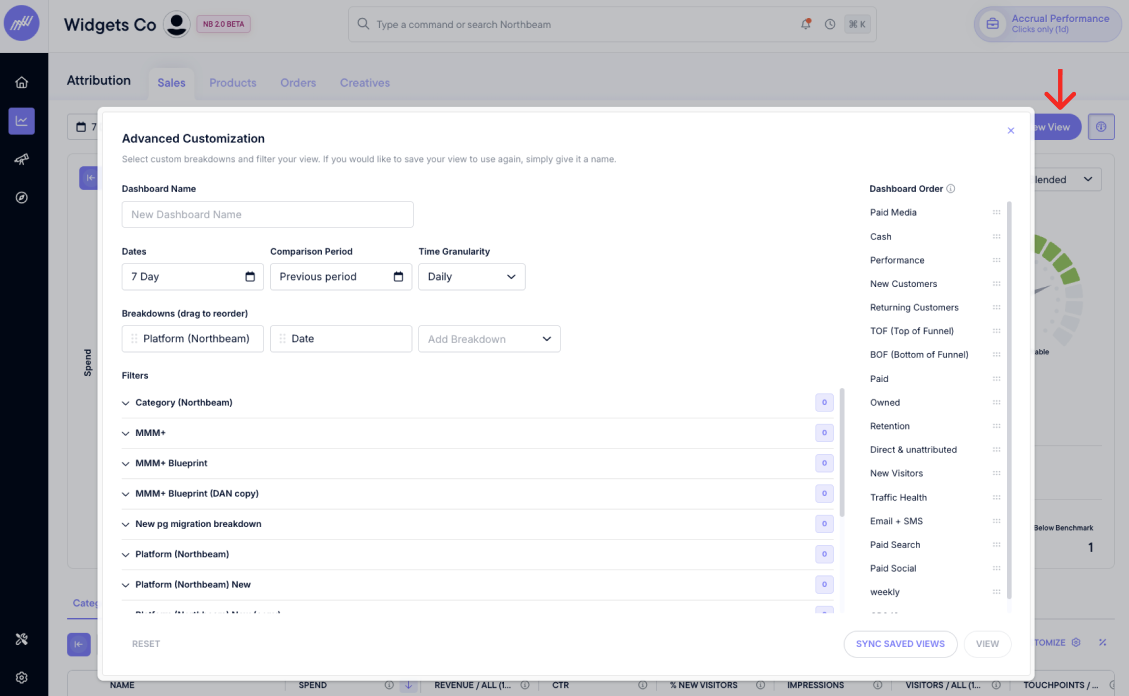
As you change your Views, be sure to save them as New.This allows you to quickly revisit these analyses anytime you want. Go crazy - we know users with 15+ custom views for one type of analysis.
Time Filters
The time filters dropdown offers options for time ranges, comparison periods, and time granularity.
Important: Time filters are dependent on the Custom View you’ve selected.If you select a different Custom View, your time filter will change to the most-recently-saved time filter for that view.
Attribution Window
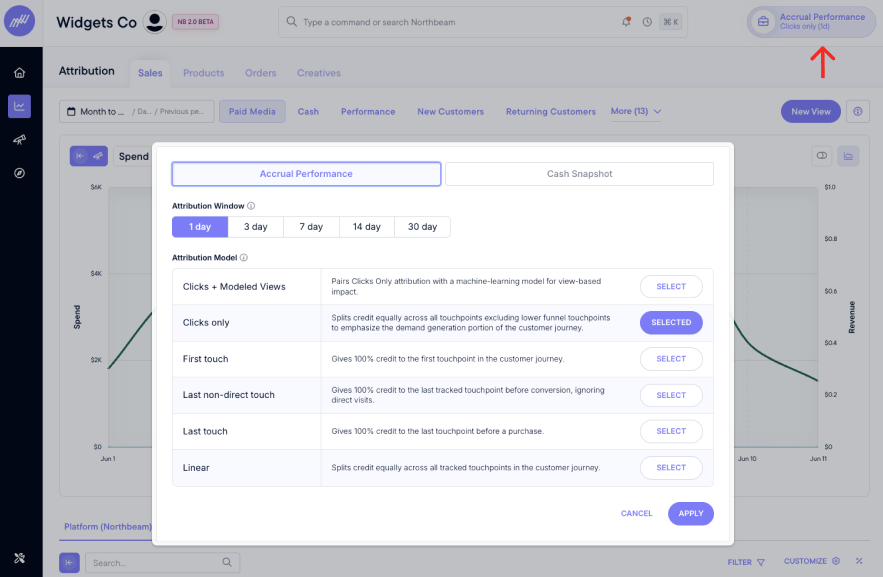
In the top right of the page, you will see a button for Attribution Window and Attribution Model. Here you can select whatever you prefer for each.
Unlike Time Filters, Attribution Window, and Model choices are persistent regardless of the Custom View you’ve selected.Be sure to set your model and window selections each time if needed. Learn more about our attribution models here.
✅ Up next
This Attribution Home Page allows you to understand daily performance and evaluate performance across campaigns, channels, and funnel stages. Let's dive deeper into the different Attribution Home Page settings.
Updated 7 months ago