
🧪 Northbeam 2.0 (Preview)
A look of what's coming.
As of June 2025, you can access a preview version of Northbeam 2.0, our upgraded analytics experience designed for speed and clarity.We invite you to try Northbeam 2.0 and share your feedback to shape the future of marketing intelligence.
How to activate Northbeam 2.0
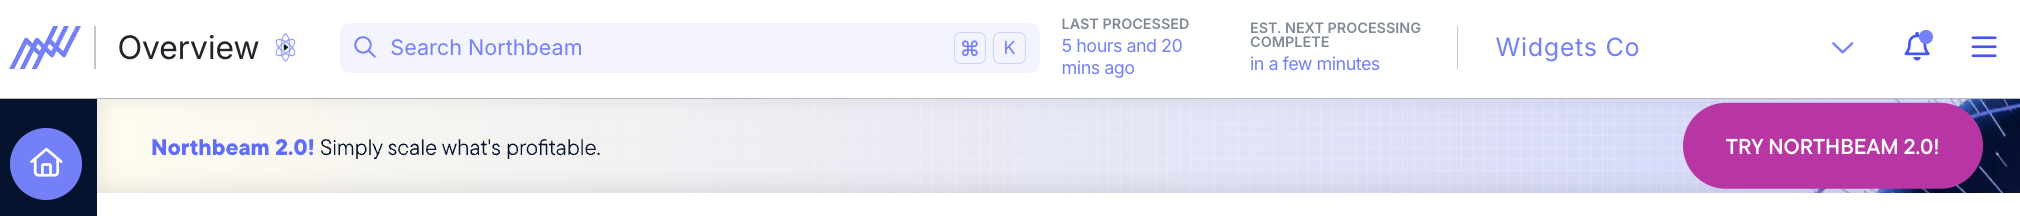
When you log in your dashboard, you can click TRY NORTHBEAM 2.0 at the top right of your dashboard.
TL;DR
It’s twice as fast: We’ve slashed loading times across the app, making your analysis faster than ever.
It’s easier to use: We’ve streamlined pages with quick pre-made analysis filters, tooltips, and a new top layer navigation.
It’s more powerful than ever: New charts, new metrics, and new touchpoints added to the tools you already love, for even deeper analysis.
What's New in Northbeam 2.0
It’s twice as fast
Load times have been significantly reduced for all dashboards. This has no impact on your metrics or dashboards besides the fact that they load faster. Enjoy!
It’s easier to use
Pages have moved: We’ve adjusted the locations of the previously-named Sales, Creative Analytics, and Product Analytics pages under one umbrella: Attribution. You can see this on the left side of your dashboard.
The Settings button is now accessible by clicking your profile image next to your account’s name in the top navigation bar.
Every page has been streamlined to reduce friction and make key tools more accessible.
- The top navigation now clearly shows your selected model, accounting mode, and lookback window at all times.
- Quick Preserved Custom Views are an upgrade to the old dashboard concept, giving you one-click access to commonly used views you want to save. Every account starts with a standard set, which you can customize. See an example here.
- Real-time visibility into order ingestion and processing queues removes the guesswork around data freshness. Read more on our Processing page.
- Tooltips are now embedded directly in tables to help you understand what each number means. Hover over a metric on any table for a more detailed view, and see the tooltip in the column header to see the definition for that metric.
- You can switch between the old user interface and the new one in the bottom left corner of the left side navigation within Northbeam.
🌜Dark mode is also available! You can toggle this by searching “dark mode” in the search bar.
It’s more powerful than ever.
The 2.0 update introduces new analysis capabilities, expanded metrics, and improved reporting tools:
- A new metric, touchpoints, is available in your tables for all platforms. It shows the most common customer journey for any breakdown you’re viewing. This is available in the Clicks-Only model.
- A new chart called the Profitability Gauge shows you what percent of your ads are profitable at any given time. Click here to see the Profitability Gauge under the Sales Attribution tab of the Attribution 2.0 page.
The Sales Attribution page (formerly the Sales page) now supports:
- Customer acquisition metrics
- Visitors (not just visits)
- Day-by-day performance through date-based breakdowns
- Customer Acquisition Cost (CAC) and Cost Per Order (CPO) are now available
- Cost Per Visitor (CPV) and Revenue Per Visitor (RPV) are now available
- Upgraded visualizations, including stacked and split line graphs
- Full screen mode for graphs and tables for deep-focused analysis
The Orders Attribution page now includes:
- Premade Saved Views for common scenarios, to help you get started
- The ability to open individual orders and see how touchpoints are credited by the model
- Filters to isolate orders where a specific platform receives credit under a selected model, accounting mode, or lookback window
We’re excited to hear what you think—reach out to Support with any feedback or questions.
Updated 7 months ago