> ## Documentation Index
> Fetch the complete documentation index at: https://docs.northbeam.io/llms.txt
> Use this file to discover all available pages before exploring further.
# Sales Page Export
> Export the performance data shown on the Sales page as a CSV download or straight into your own Google Cloud Storage bucket, once or on a schedule.
The Sales page export returns the performance data you are already looking at — the chart or the table — as a file. It requires no API key and no engineering work, which makes it the right choice for most one-off analysis and recurring reports.
For row-level touchpoint data, use the [Touchpoints Export](/docs/touchpoints-export) instead. To build a pipeline, use the [Data Export API](/docs/northbeam-api-data-export-1).
## One-time or scheduled
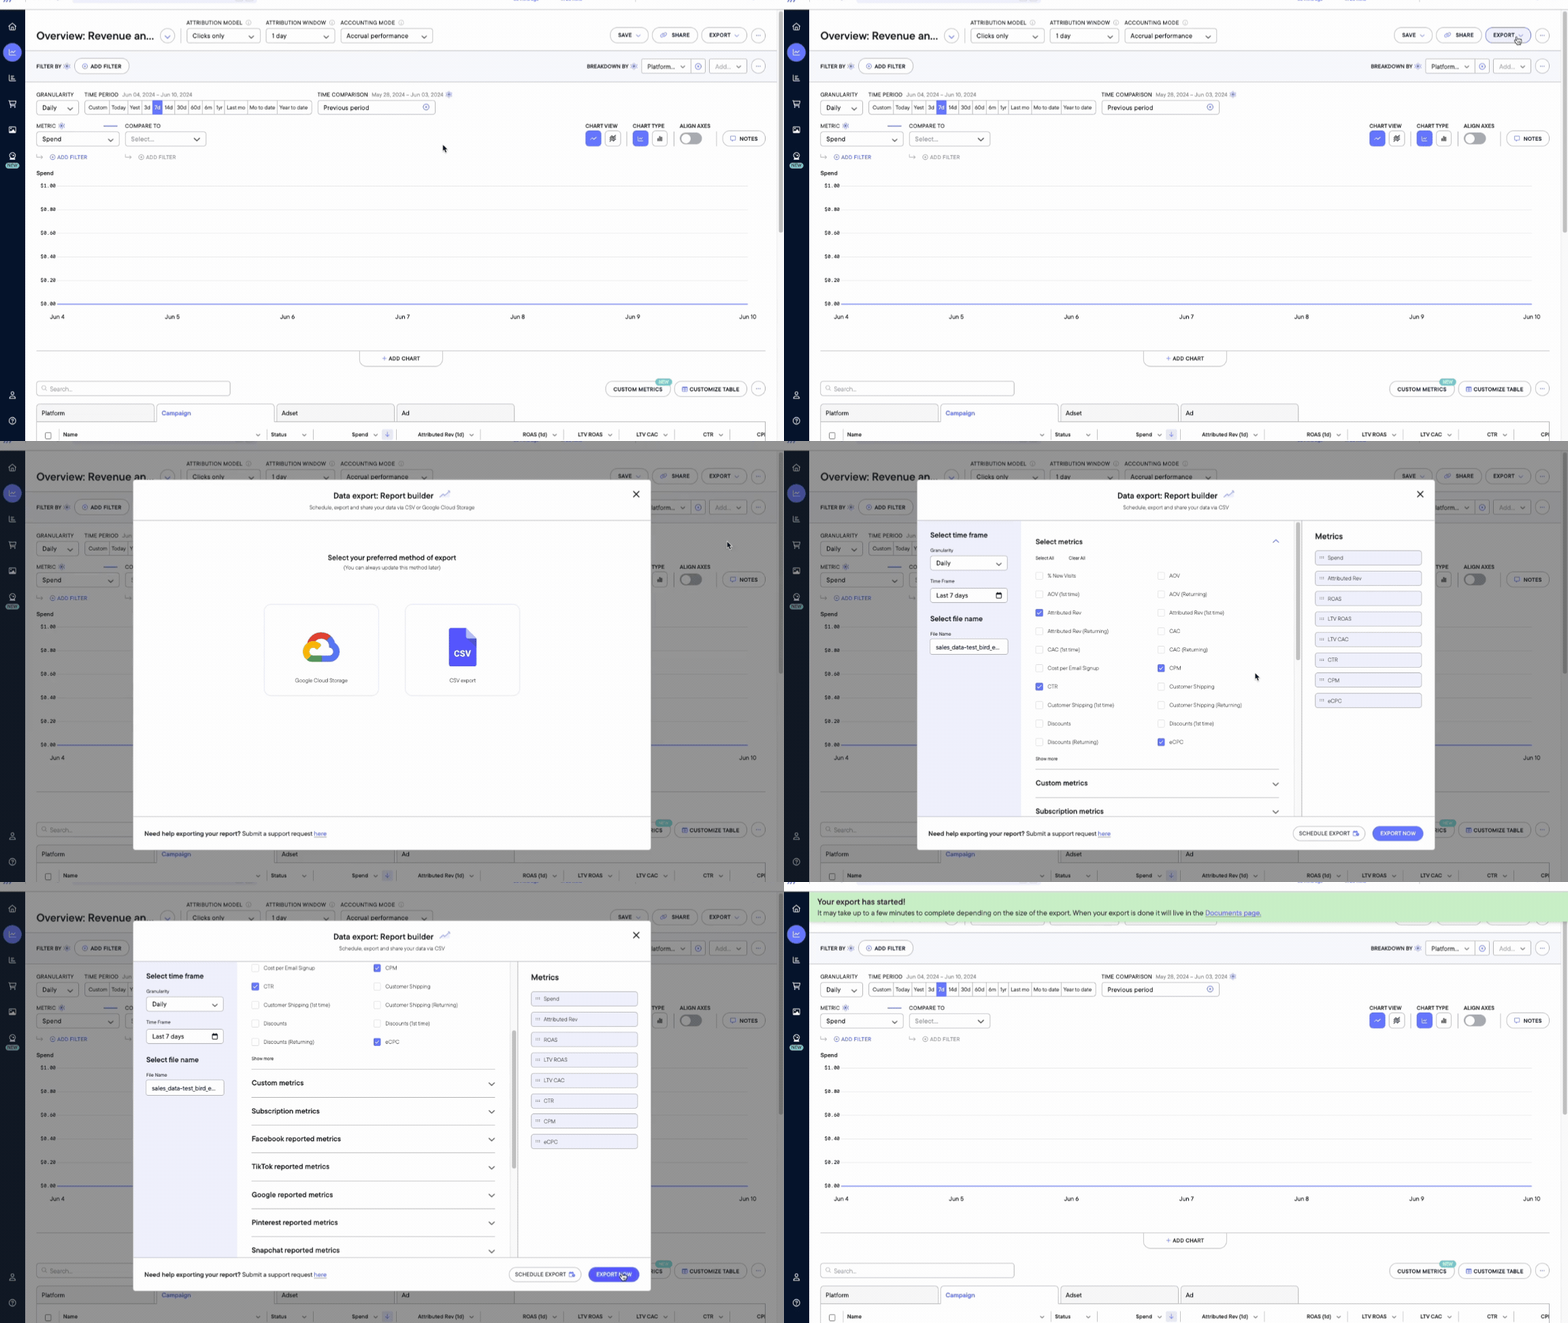
* **One-time:** select your metrics, click **Export Now**, then open [Documents](https://dashboard.northbeam.io/customers/documents) to download the file.
* **Scheduled:** click **Schedule Report** and choose daily, weekly, or monthly. You will receive an email with a link to each completed file.
***
## Export a CSV
1. Open the [Sales page](https://dashboard.northbeam.io/sales).
2. Click **Export**.
3. Select **Chart Values** or **Table Values**:
* **Chart Values** exports the data behind the line chart.
* **Table Values** exports the data in the table.
4. If you selected **Table Values**, click **CSV Export**.
5. Use the **Report Builder** to configure the report.
6. Click **Export Now** for a single file, or **Schedule Report** for a recurring export.
 ## Table export options
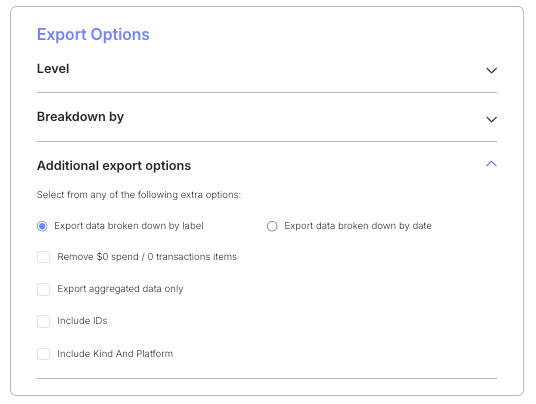
These options appear in the Report Builder when you export **Table Values**.
| Option | What it does |
| :- | :- |
| **Export data broken down by label** | Groups data by the selected labels without breaking it out by date. |
| **Export data broken out by date** | Breaks data out using the selected granularity. Daily is the default; weekly periods run Sunday through Saturday. |
| **Remove \$0 / 0 transaction items** | Removes rows valued at \$0 or with zero transactions. |
| **Export aggregated data only** | Consolidates the selected level instead of returning its individual rows. With Campaign level selected, all campaigns are combined. |
| **Include IDs** | Adds Campaign, Ad Set, or Ad ID columns, depending on the level selected. |
| **Include Kind and Platform** | Adds Northbeam-specific columns describing the traffic source. |
## Table export options
These options appear in the Report Builder when you export **Table Values**.
| Option | What it does |
| :- | :- |
| **Export data broken down by label** | Groups data by the selected labels without breaking it out by date. |
| **Export data broken out by date** | Breaks data out using the selected granularity. Daily is the default; weekly periods run Sunday through Saturday. |
| **Remove \$0 / 0 transaction items** | Removes rows valued at \$0 or with zero transactions. |
| **Export aggregated data only** | Consolidates the selected level instead of returning its individual rows. With Campaign level selected, all campaigns are combined. |
| **Include IDs** | Adds Campaign, Ad Set, or Ad ID columns, depending on the level selected. |
| **Include Kind and Platform** | Adds Northbeam-specific columns describing the traffic source. |
 ***
## Export to Google Cloud Storage
Use this when you want the Sales table export delivered directly to your own GCS bucket rather than downloaded.
1. Open the [Sales page](https://dashboard.northbeam.io/sales).
2. Click **Export**.
3. Select **Table Values**.
4. Click **Google Cloud Storage**.
5. Grant **Storage Object Admin** access to `nb-data-export@north-beam-io.iam.gserviceaccount.com` in your bucket's IAM settings.
6. Under **Add Your Bucket**, enter your bucket name.
7. Click **Validate** to confirm Northbeam can reach the bucket.
Chart Values cannot be sent to GCS — this option is available for **Table Values** only.
***
## Export to Google Cloud Storage
Use this when you want the Sales table export delivered directly to your own GCS bucket rather than downloaded.
1. Open the [Sales page](https://dashboard.northbeam.io/sales).
2. Click **Export**.
3. Select **Table Values**.
4. Click **Google Cloud Storage**.
5. Grant **Storage Object Admin** access to `nb-data-export@north-beam-io.iam.gserviceaccount.com` in your bucket's IAM settings.
6. Under **Add Your Bucket**, enter your bucket name.
7. Click **Validate** to confirm Northbeam can reach the bucket.
Chart Values cannot be sent to GCS — this option is available for **Table Values** only.